Lexington County, South Carolina Nativity & Citizenship Status (2024)
Place of birth and citizenship status analysis for Lexington County, South Carolina
Lexington County, South Carolina Nativity & Citizenship Indicators (2024)
Native Born
93.5%
Foreign Born
6.5%
Naturalized
2.8%
US Citizens
96.3%
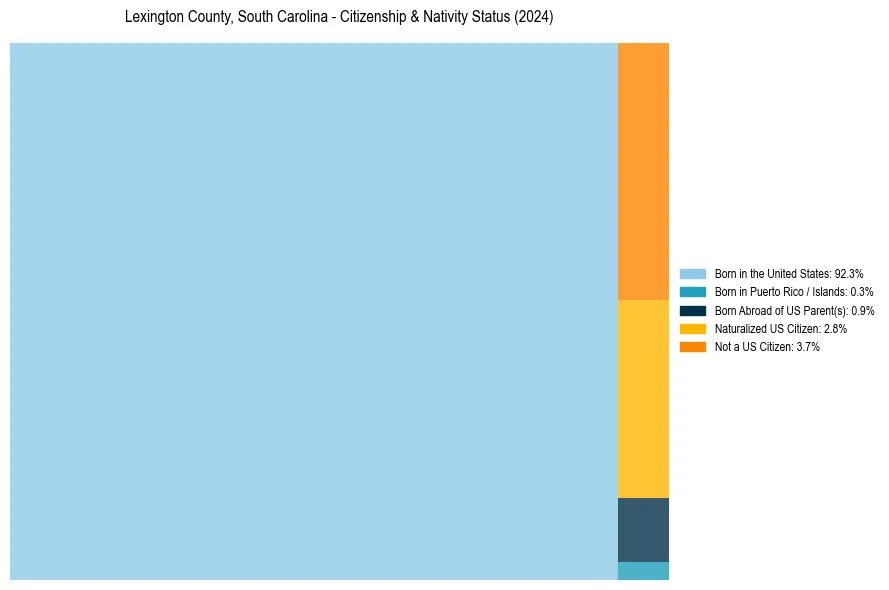
Lexington County, South Carolina Nativity & Citizenship Distribution
Lexington County, South Carolina Historical Nativity Trends (2010–2024)
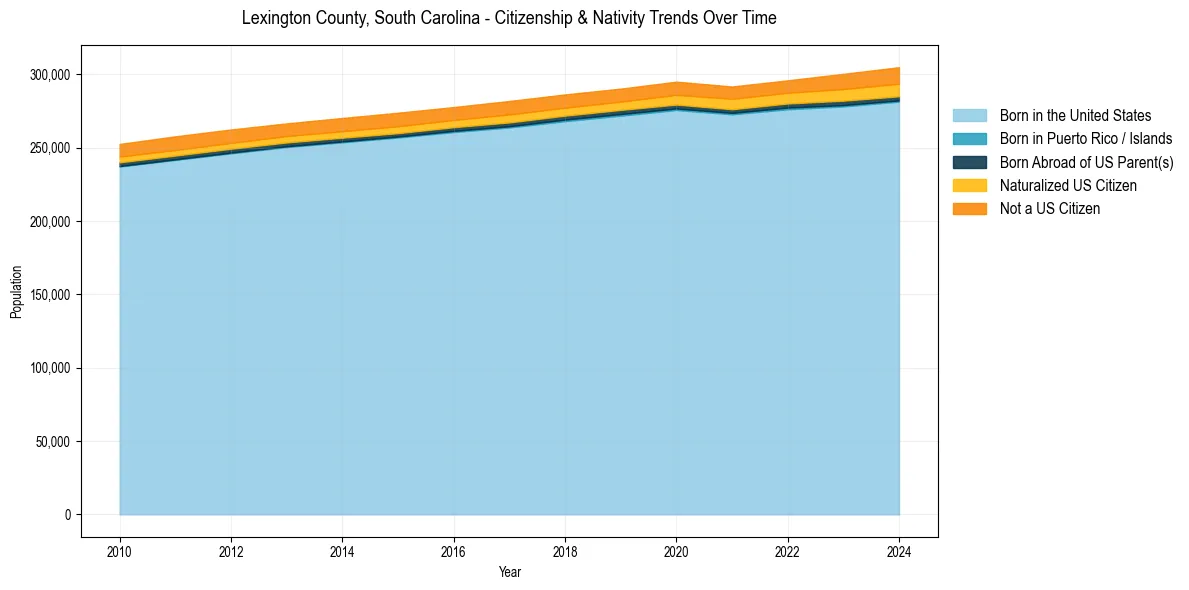
Lexington County, South Carolina Population & Nativity History
| Year | Total Pop | Foreign Born | Native Born |
|---|---|---|---|
| 2024 | 304,887 | 6.5% | 93.5% |
| 2023 | 300,370 | 6.1% | 93.9% |
| 2022 | 295,934 | 5.3% | 94.7% |
| 2021 | 291,723 | 5.3% | 94.7% |
| 2020 | 295,033 | 5.3% | 94.7% |
| 2019 | 290,278 | 5.0% | 95.0% |
| 2018 | 286,316 | 5.1% | 94.9% |
| 2017 | 281,870 | 5.2% | 94.8% |
| 2016 | 277,702 | 4.9% | 95.1% |
| 2015 | 273,843 | 5.1% | 94.9% |
| 2014 | 270,263 | 5.0% | 95.0% |
| 2013 | 266,575 | 4.9% | 95.1% |
| 2012 | 262,424 | 5.0% | 95.0% |
| 2011 | 257,756 | 5.1% | 94.9% |
| 2010 | 252,563 | 5.0% | 95.0% |
Nativity & Citizenship FAQs for Lexington County, South Carolina
Approximately 6.5% of residents in Lexington County, South Carolina were born outside the United States.
The vast majority of residents, roughly 96.3%, are U.S. citizens (including both native-born and naturalized citizens).