Lancaster County, South Carolina Nativity & Citizenship Status (2024)
Place of birth and citizenship status analysis for Lancaster County, South Carolina
Lancaster County, South Carolina Nativity & Citizenship Indicators (2024)
Native Born
92.9%
Foreign Born
7.1%
Naturalized
3.5%
US Citizens
96.4%
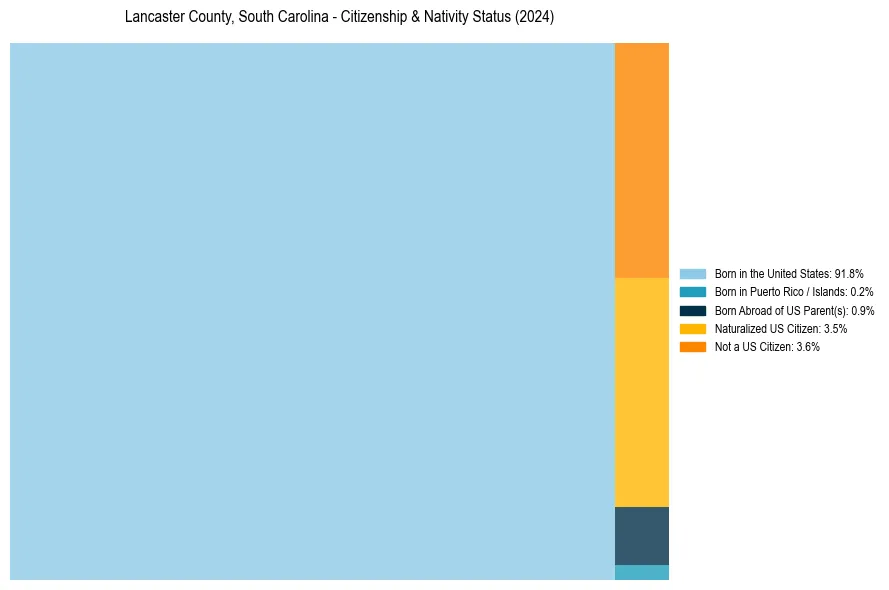
Lancaster County, South Carolina Nativity & Citizenship Distribution
Lancaster County, South Carolina Historical Nativity Trends (2010–2024)
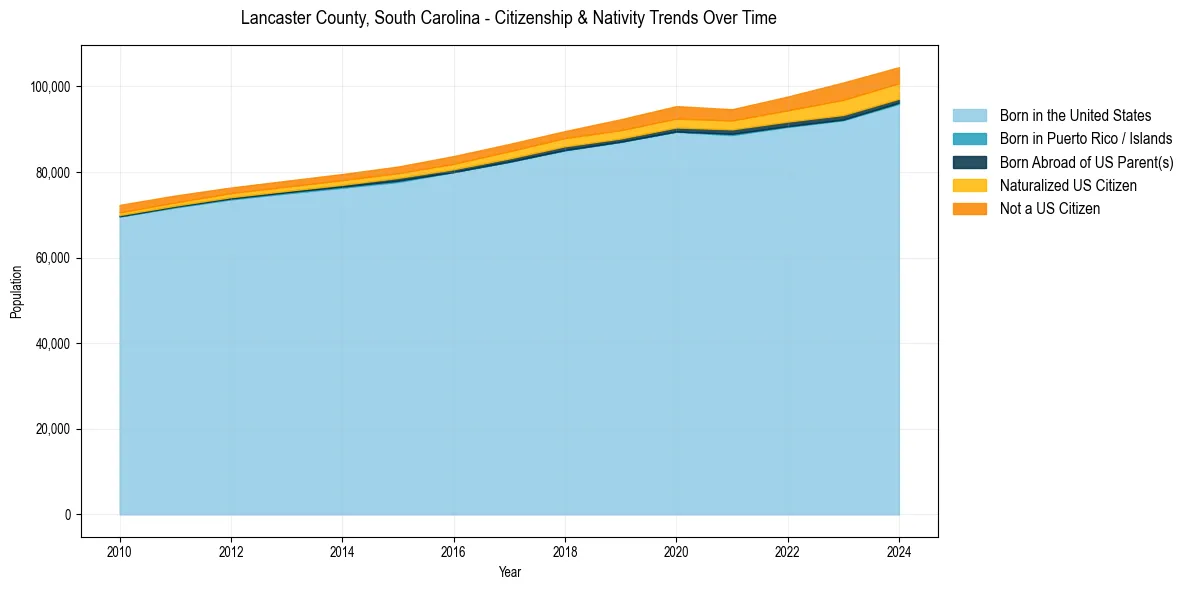
Lancaster County, South Carolina Population & Nativity History
| Year | Total Pop | Foreign Born | Native Born |
|---|---|---|---|
| 2024 | 104,475 | 7.1% | 92.9% |
| 2023 | 100,905 | 7.5% | 92.5% |
| 2022 | 97,611 | 6.0% | 94.0% |
| 2021 | 94,653 | 5.0% | 95.0% |
| 2020 | 95,378 | 5.2% | 94.8% |
| 2019 | 92,308 | 4.9% | 95.1% |
| 2018 | 89,546 | 4.0% | 96.0% |
| 2017 | 86,544 | 3.9% | 96.1% |
| 2016 | 83,704 | 3.7% | 96.3% |
| 2015 | 81,263 | 3.3% | 96.7% |
| 2014 | 79,515 | 3.2% | 96.8% |
| 2013 | 77,946 | 3.1% | 96.9% |
| 2012 | 76,364 | 3.0% | 97.0% |
| 2011 | 74,500 | 3.2% | 96.8% |
| 2010 | 72,302 | 3.3% | 96.7% |
Nativity & Citizenship FAQs for Lancaster County, South Carolina
Approximately 7.1% of residents in Lancaster County, South Carolina were born outside the United States.
The vast majority of residents, roughly 96.4%, are U.S. citizens (including both native-born and naturalized citizens).