Kershaw County, South Carolina Nativity & Citizenship Status (2024)
Place of birth and citizenship status analysis for Kershaw County, South Carolina
Kershaw County, South Carolina Nativity & Citizenship Indicators (2024)
Native Born
96.8%
Foreign Born
3.2%
Naturalized
1.7%
US Citizens
98.5%
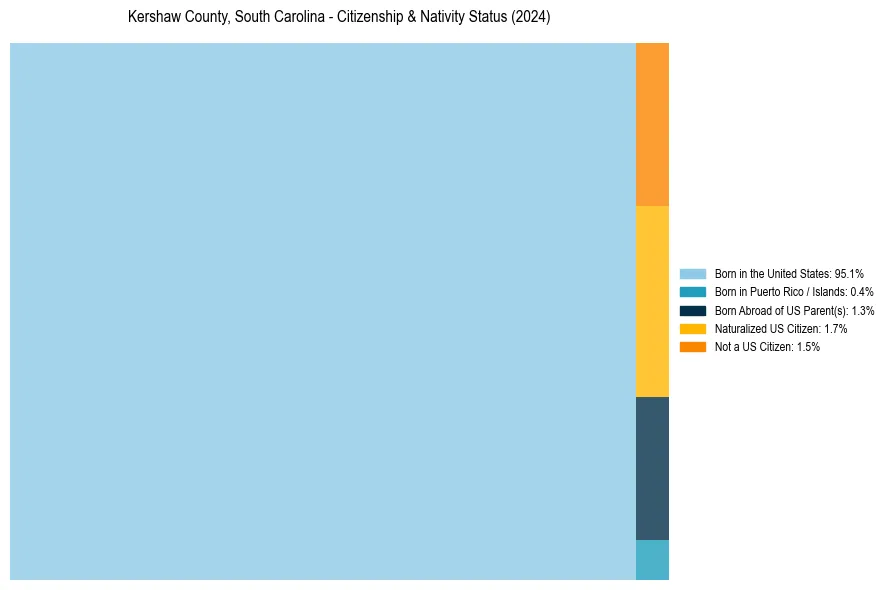
Kershaw County, South Carolina Nativity & Citizenship Distribution
Kershaw County, South Carolina Historical Nativity Trends (2010–2024)
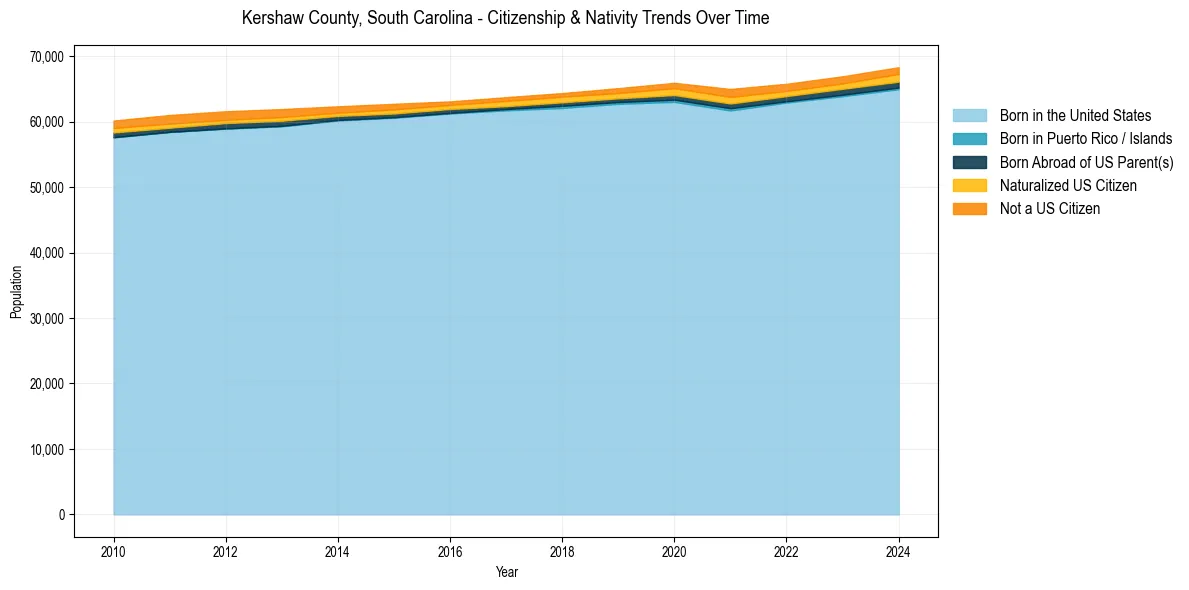
Kershaw County, South Carolina Population & Nativity History
| Year | Total Pop | Foreign Born | Native Born |
|---|---|---|---|
| 2024 | 68,314 | 3.2% | 96.8% |
| 2023 | 66,924 | 2.9% | 97.1% |
| 2022 | 65,779 | 2.9% | 97.1% |
| 2021 | 64,989 | 3.4% | 96.6% |
| 2020 | 65,926 | 2.8% | 97.2% |
| 2019 | 65,112 | 2.4% | 97.6% |
| 2018 | 64,361 | 2.2% | 97.8% |
| 2017 | 63,734 | 2.2% | 97.8% |
| 2016 | 63,090 | 1.8% | 98.2% |
| 2015 | 62,722 | 2.4% | 97.6% |
| 2014 | 62,342 | 2.4% | 97.6% |
| 2013 | 61,918 | 2.9% | 97.1% |
| 2012 | 61,583 | 2.9% | 97.1% |
| 2011 | 61,010 | 3.2% | 96.8% |
| 2010 | 60,166 | 3.0% | 97.0% |
Nativity & Citizenship FAQs for Kershaw County, South Carolina
Approximately 3.2% of residents in Kershaw County, South Carolina were born outside the United States.
The vast majority of residents, roughly 98.5%, are U.S. citizens (including both native-born and naturalized citizens).