Horry County, South Carolina Nativity & Citizenship Status (2024)
Place of birth and citizenship status analysis for Horry County, South Carolina
Horry County, South Carolina Nativity & Citizenship Indicators (2024)
Native Born
93.3%
Foreign Born
6.7%
Naturalized
3.4%
US Citizens
96.7%
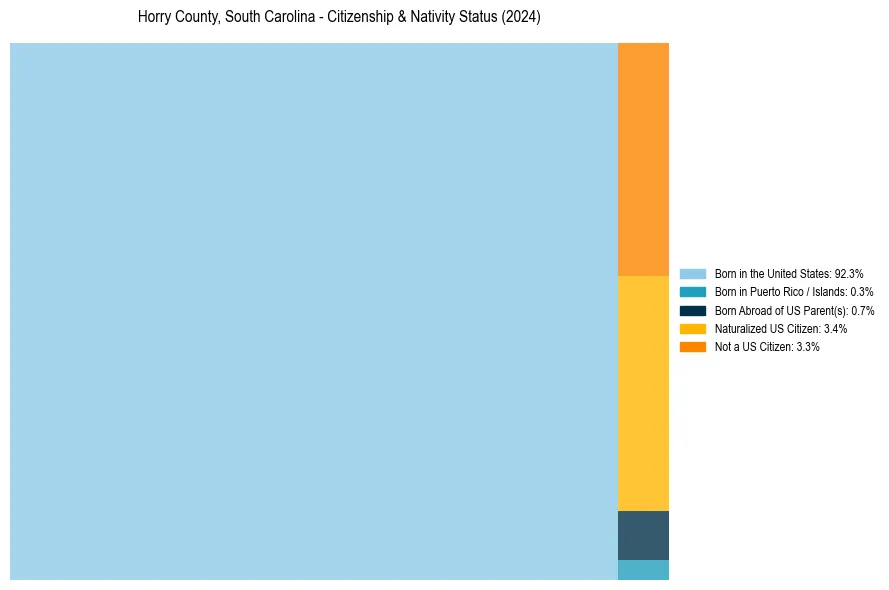
Horry County, South Carolina Nativity & Citizenship Distribution
Horry County, South Carolina Historical Nativity Trends (2010–2024)
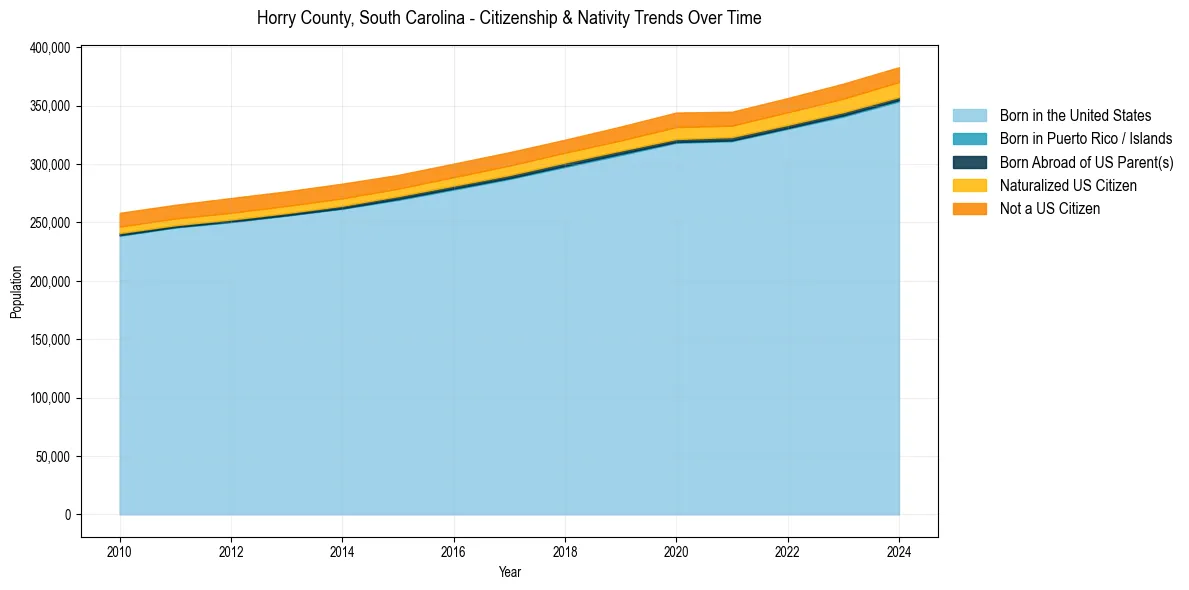
Horry County, South Carolina Population & Nativity History
| Year | Total Pop | Foreign Born | Native Born |
|---|---|---|---|
| 2024 | 383,016 | 6.7% | 93.3% |
| 2023 | 368,937 | 6.6% | 93.4% |
| 2022 | 356,578 | 6.5% | 93.5% |
| 2021 | 344,865 | 6.3% | 93.7% |
| 2020 | 344,186 | 6.6% | 93.4% |
| 2019 | 332,172 | 6.2% | 93.8% |
| 2018 | 320,915 | 6.1% | 93.9% |
| 2017 | 310,186 | 6.3% | 93.7% |
| 2016 | 300,418 | 6.3% | 93.7% |
| 2015 | 290,730 | 6.3% | 93.7% |
| 2014 | 283,280 | 6.7% | 93.3% |
| 2013 | 276,688 | 6.7% | 93.3% |
| 2012 | 270,943 | 6.8% | 93.2% |
| 2011 | 265,139 | 6.6% | 93.4% |
| 2010 | 258,267 | 6.7% | 93.3% |
Nativity & Citizenship FAQs for Horry County, South Carolina
Approximately 6.7% of residents in Horry County, South Carolina were born outside the United States.
The vast majority of residents, roughly 96.7%, are U.S. citizens (including both native-born and naturalized citizens).