Dorchester County, South Carolina Nativity & Citizenship Status (2024)
Place of birth and citizenship status analysis for Dorchester County, South Carolina
Dorchester County, South Carolina Nativity & Citizenship Indicators (2024)
Native Born
94.5%
Foreign Born
5.5%
Naturalized
3.0%
US Citizens
97.5%
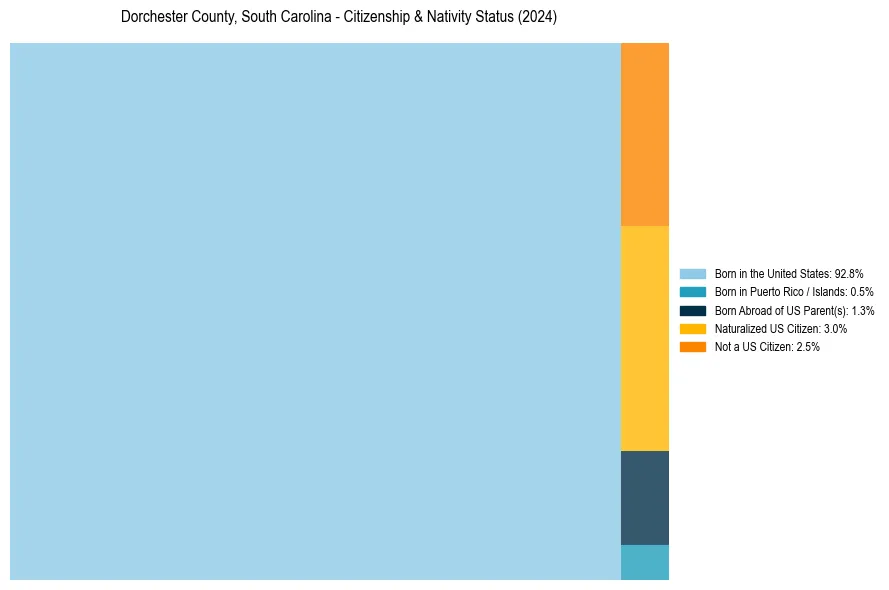
Dorchester County, South Carolina Nativity & Citizenship Distribution
Dorchester County, South Carolina Historical Nativity Trends (2010–2024)
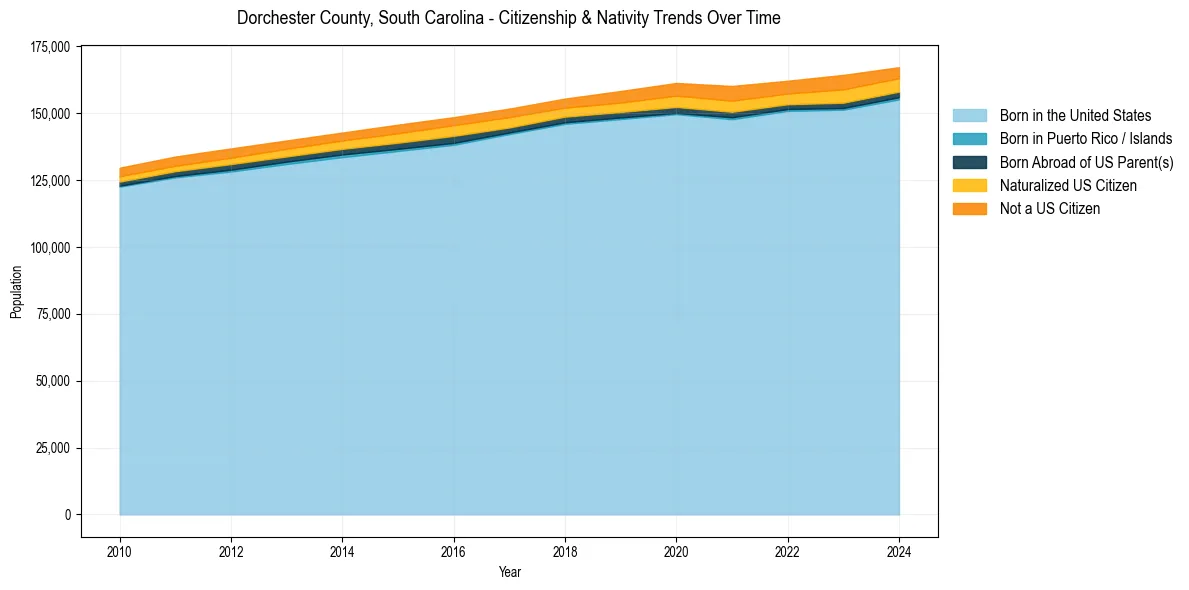
Dorchester County, South Carolina Population & Nativity History
| Year | Total Pop | Foreign Born | Native Born |
|---|---|---|---|
| 2024 | 167,201 | 5.5% | 94.5% |
| 2023 | 164,322 | 6.3% | 93.7% |
| 2022 | 162,139 | 5.4% | 94.6% |
| 2021 | 160,180 | 6.0% | 94.0% |
| 2020 | 161,309 | 5.6% | 94.4% |
| 2019 | 158,299 | 5.0% | 95.0% |
| 2018 | 155,474 | 4.4% | 95.6% |
| 2017 | 151,716 | 4.7% | 95.3% |
| 2016 | 148,517 | 4.7% | 95.3% |
| 2015 | 145,715 | 4.6% | 95.4% |
| 2014 | 142,772 | 4.3% | 95.7% |
| 2013 | 139,802 | 4.3% | 95.7% |
| 2012 | 136,836 | 4.3% | 95.7% |
| 2011 | 133,796 | 4.1% | 95.9% |
| 2010 | 129,618 | 4.0% | 96.0% |
Nativity & Citizenship FAQs for Dorchester County, South Carolina
Approximately 5.5% of residents in Dorchester County, South Carolina were born outside the United States.
The vast majority of residents, roughly 97.5%, are U.S. citizens (including both native-born and naturalized citizens).