Berkeley County, South Carolina Nativity & Citizenship Status (2024)
Place of birth and citizenship status analysis for Berkeley County, South Carolina
Berkeley County, South Carolina Nativity & Citizenship Indicators (2024)
Native Born
93.3%
Foreign Born
6.7%
Naturalized
3.0%
US Citizens
96.3%
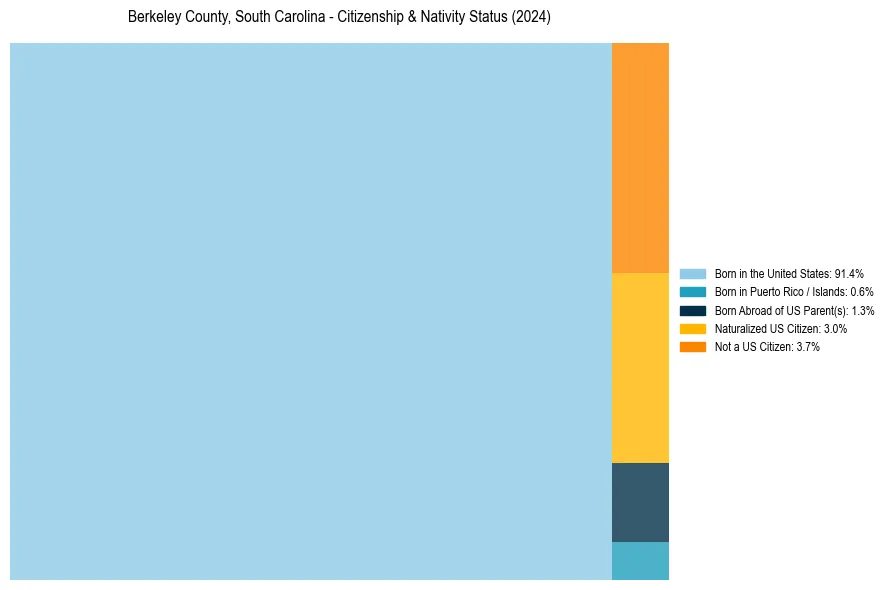
Berkeley County, South Carolina Nativity & Citizenship Distribution
Berkeley County, South Carolina Historical Nativity Trends (2010–2024)
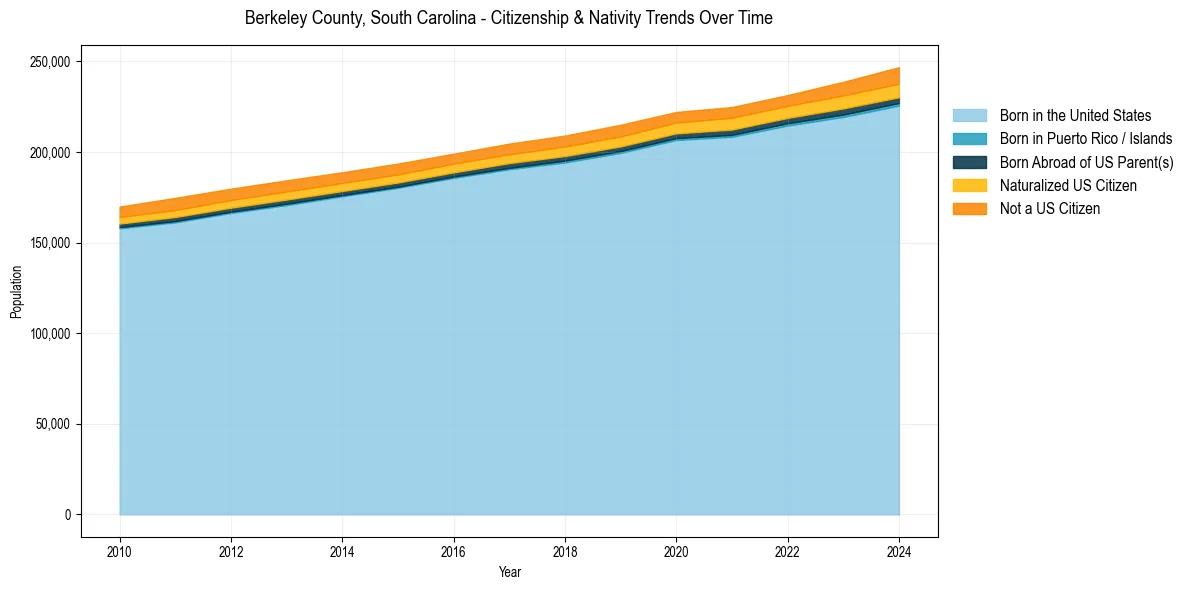
Berkeley County, South Carolina Population & Nativity History
| Year | Total Pop | Foreign Born | Native Born |
|---|---|---|---|
| 2024 | 246,802 | 6.7% | 93.3% |
| 2023 | 238,723 | 6.2% | 93.8% |
| 2022 | 231,419 | 5.4% | 94.6% |
| 2021 | 224,806 | 5.5% | 94.5% |
| 2020 | 222,103 | 5.3% | 94.7% |
| 2019 | 215,044 | 5.6% | 94.4% |
| 2018 | 209,065 | 5.4% | 94.6% |
| 2017 | 204,632 | 5.3% | 94.7% |
| 2016 | 199,081 | 5.2% | 94.8% |
| 2015 | 193,613 | 5.4% | 94.6% |
| 2014 | 188,835 | 5.5% | 94.5% |
| 2013 | 184,366 | 5.8% | 94.2% |
| 2012 | 179,773 | 5.9% | 94.1% |
| 2011 | 174,679 | 6.1% | 93.9% |
| 2010 | 169,878 | 5.5% | 94.5% |
Nativity & Citizenship FAQs for Berkeley County, South Carolina
Approximately 6.7% of residents in Berkeley County, South Carolina were born outside the United States.
The vast majority of residents, roughly 96.3%, are U.S. citizens (including both native-born and naturalized citizens).