Beaufort County, South Carolina Nativity & Citizenship Status (2024)
Place of birth and citizenship status analysis for Beaufort County, South Carolina
Beaufort County, South Carolina Nativity & Citizenship Indicators (2024)
Native Born
92.3%
Foreign Born
7.7%
Naturalized
3.0%
US Citizens
95.2%
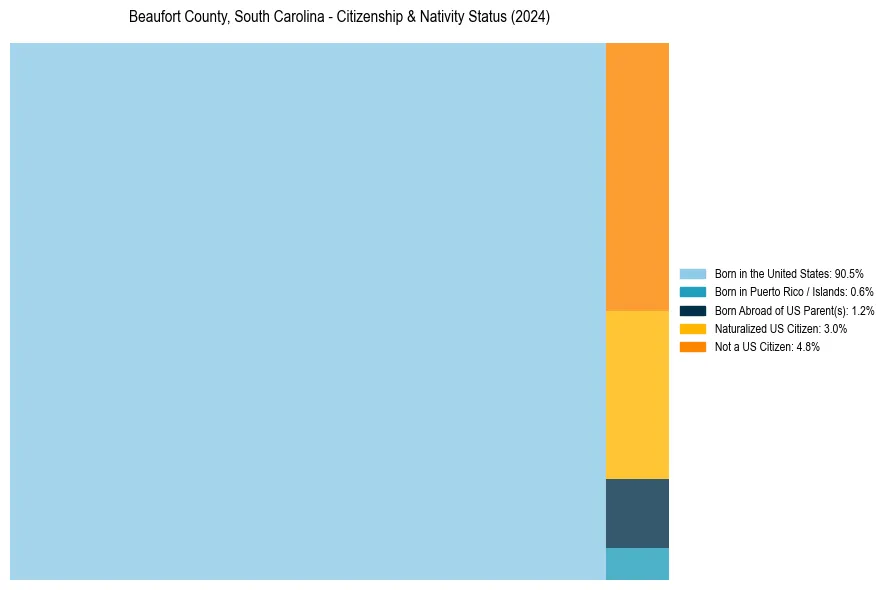
Beaufort County, South Carolina Nativity & Citizenship Distribution
Beaufort County, South Carolina Historical Nativity Trends (2010–2024)
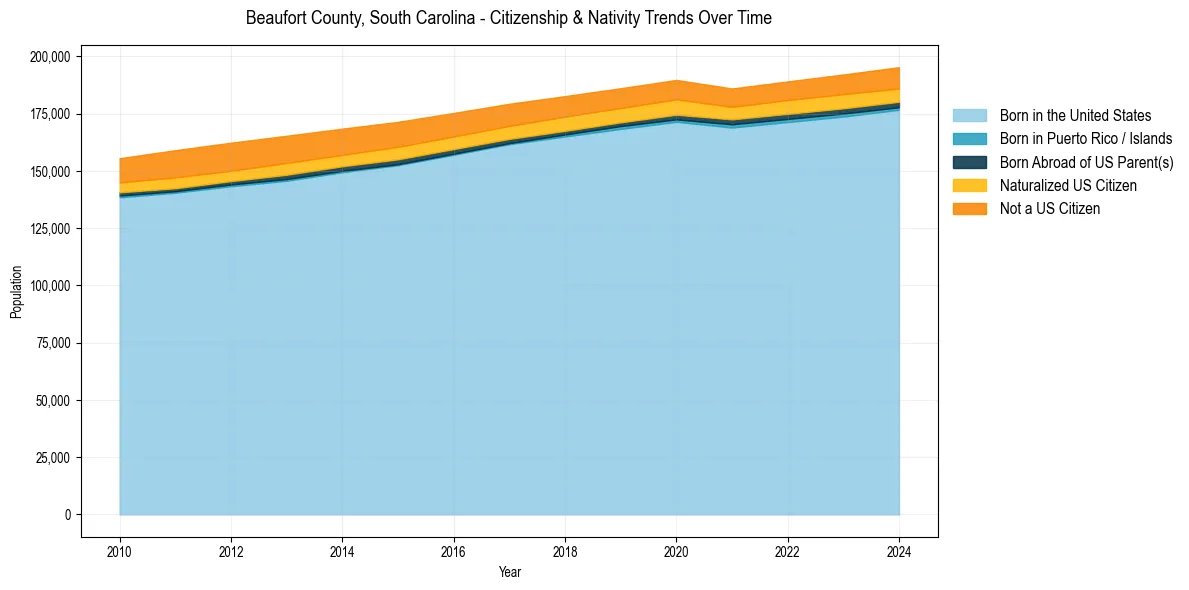
Beaufort County, South Carolina Population & Nativity History
| Year | Total Pop | Foreign Born | Native Born |
|---|---|---|---|
| 2024 | 195,289 | 7.7% | 92.3% |
| 2023 | 192,123 | 7.7% | 92.3% |
| 2022 | 189,071 | 7.5% | 92.5% |
| 2021 | 186,007 | 7.3% | 92.7% |
| 2020 | 189,732 | 8.0% | 92.0% |
| 2019 | 186,095 | 8.0% | 92.0% |
| 2018 | 182,658 | 8.3% | 91.7% |
| 2017 | 179,316 | 8.6% | 91.4% |
| 2016 | 175,316 | 9.0% | 91.0% |
| 2015 | 171,420 | 9.6% | 90.4% |
| 2014 | 168,453 | 9.8% | 90.2% |
| 2013 | 165,354 | 10.3% | 89.7% |
| 2012 | 162,316 | 10.3% | 89.7% |
| 2011 | 159,048 | 10.5% | 89.5% |
| 2010 | 155,550 | 9.6% | 90.4% |
Nativity & Citizenship FAQs for Beaufort County, South Carolina
Approximately 7.7% of residents in Beaufort County, South Carolina were born outside the United States.
The vast majority of residents, roughly 95.2%, are U.S. citizens (including both native-born and naturalized citizens).