Anderson County, South Carolina Nativity & Citizenship Status (2024)
Place of birth and citizenship status analysis for Anderson County, South Carolina
Anderson County, South Carolina Nativity & Citizenship Indicators (2024)
Native Born
96.1%
Foreign Born
3.9%
Naturalized
1.9%
US Citizens
98.0%
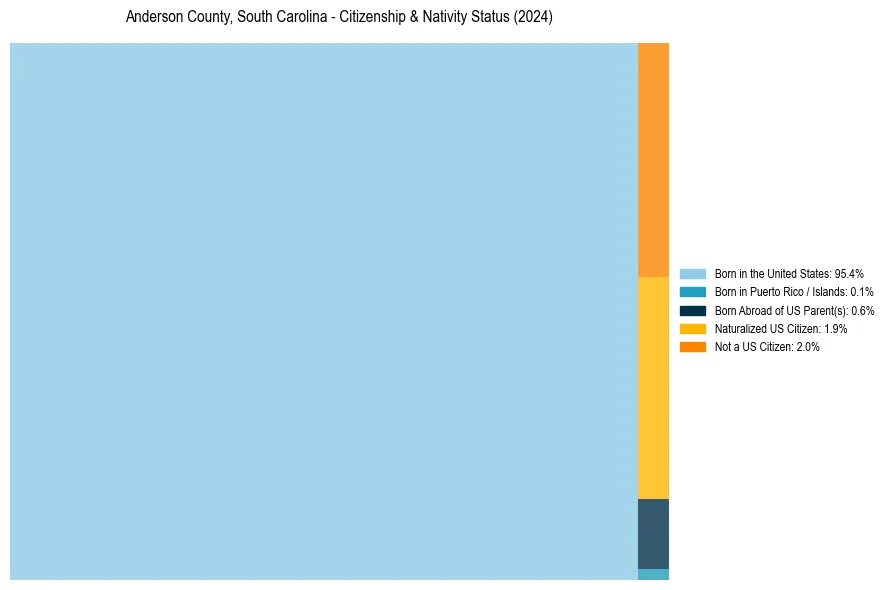
Anderson County, South Carolina Nativity & Citizenship Distribution
Anderson County, South Carolina Historical Nativity Trends (2010–2024)
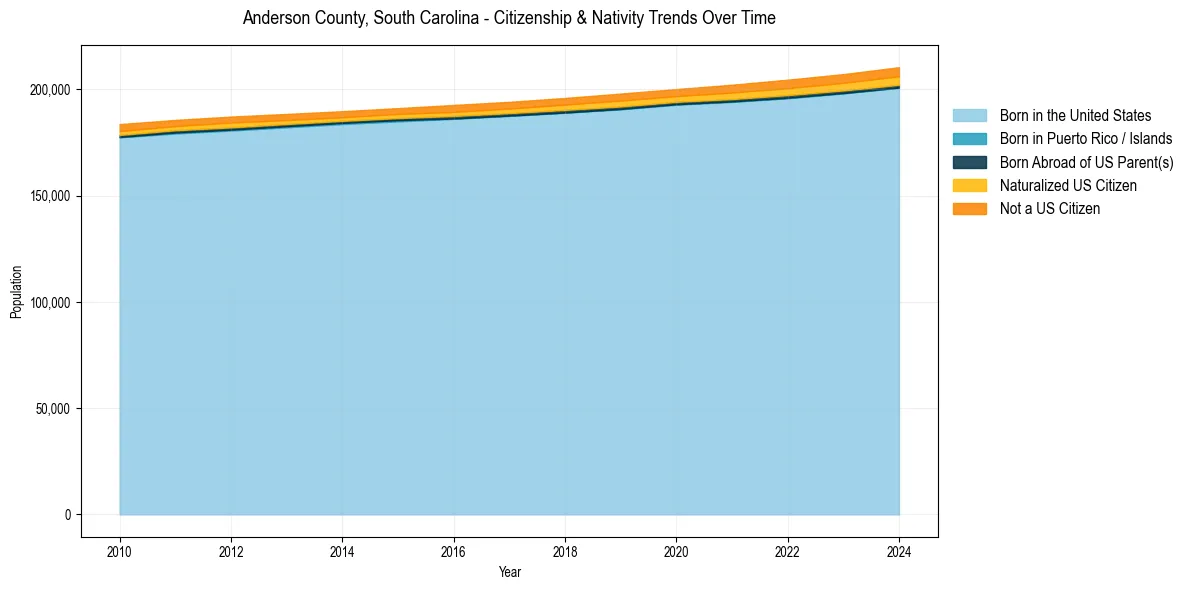
Anderson County, South Carolina Population & Nativity History
| Year | Total Pop | Foreign Born | Native Born |
|---|---|---|---|
| 2024 | 210,478 | 3.9% | 96.1% |
| 2023 | 207,218 | 3.7% | 96.3% |
| 2022 | 204,592 | 3.6% | 96.4% |
| 2021 | 202,223 | 3.3% | 96.7% |
| 2020 | 200,183 | 3.0% | 97.0% |
| 2019 | 198,064 | 3.1% | 96.9% |
| 2018 | 195,995 | 2.9% | 97.1% |
| 2017 | 194,174 | 2.7% | 97.3% |
| 2016 | 192,709 | 2.7% | 97.3% |
| 2015 | 191,215 | 2.5% | 97.5% |
| 2014 | 189,763 | 2.4% | 97.6% |
| 2013 | 188,480 | 2.5% | 97.5% |
| 2012 | 187,228 | 2.7% | 97.3% |
| 2011 | 185,675 | 2.6% | 97.4% |
| 2010 | 183,691 | 2.8% | 97.2% |
Nativity & Citizenship FAQs for Anderson County, South Carolina
Approximately 3.9% of residents in Anderson County, South Carolina were born outside the United States.
The vast majority of residents, roughly 98.0%, are U.S. citizens (including both native-born and naturalized citizens).