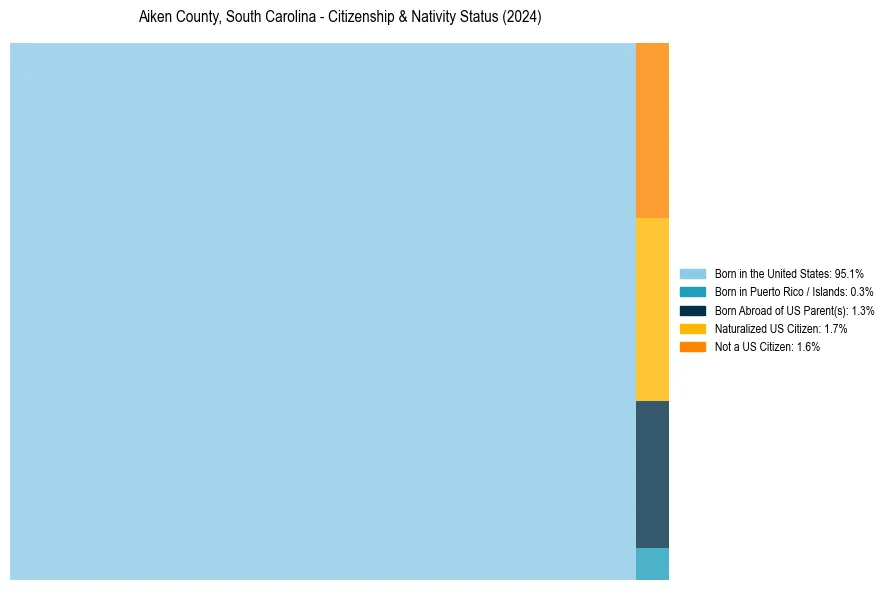
Aiken County, South Carolina Nativity & Citizenship Status (2024)
Place of birth and citizenship status analysis for Aiken County, South Carolina
Aiken County, South Carolina Nativity & Citizenship Indicators (2024)
Native Born
96.7%
Foreign Born
3.3%
Naturalized
1.7%
US Citizens
98.4%
Aiken County, South Carolina Nativity & Citizenship Distribution
Aiken County, South Carolina Historical Nativity Trends (2010–2024)
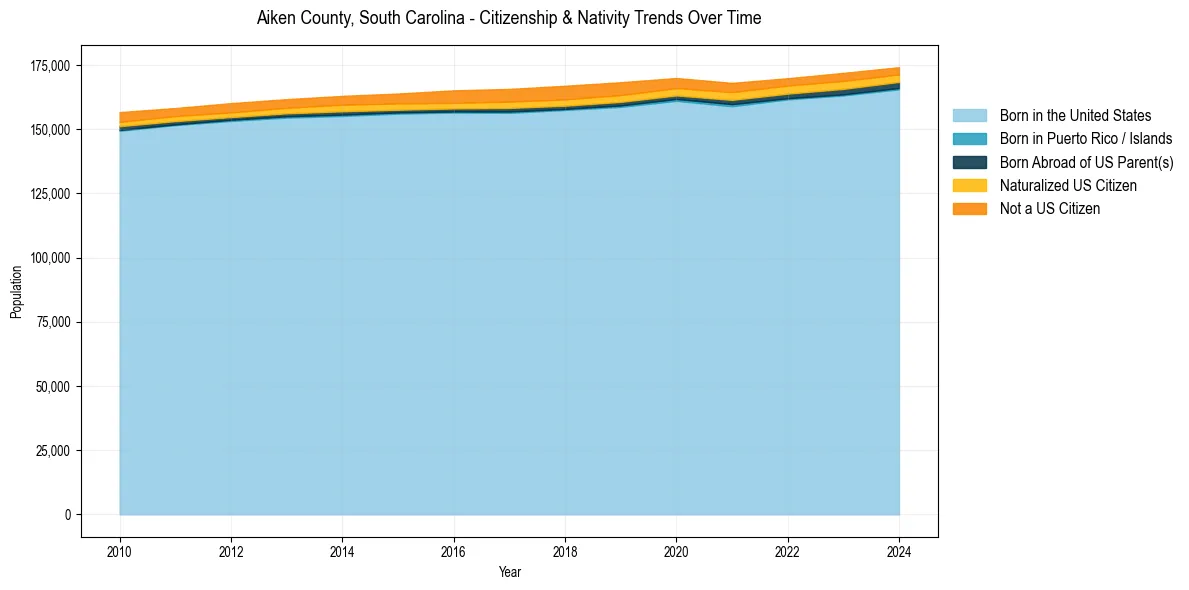
Aiken County, South Carolina Population & Nativity History
| Year | Total Pop | Foreign Born | Native Born |
|---|---|---|---|
| 2024 | 174,160 | 3.3% | 96.7% |
| 2023 | 171,949 | 3.6% | 96.4% |
| 2022 | 169,865 | 3.5% | 96.5% |
| 2021 | 168,045 | 3.9% | 96.1% |
| 2020 | 169,947 | 4.0% | 96.0% |
| 2019 | 168,301 | 4.5% | 95.5% |
| 2018 | 166,926 | 4.7% | 95.3% |
| 2017 | 165,707 | 4.5% | 95.5% |
| 2016 | 165,146 | 4.3% | 95.7% |
| 2015 | 163,908 | 3.9% | 96.1% |
| 2014 | 162,991 | 3.7% | 96.3% |
| 2013 | 161,710 | 3.4% | 96.6% |
| 2012 | 160,169 | 3.4% | 96.6% |
| 2011 | 158,253 | 3.2% | 96.8% |
| 2010 | 156,670 | 3.5% | 96.5% |
Nativity & Citizenship FAQs for Aiken County, South Carolina
Approximately 3.3% of residents in Aiken County, South Carolina were born outside the United States.
The vast majority of residents, roughly 98.4%, are U.S. citizens (including both native-born and naturalized citizens).