Providence County, Rhode Island Nativity & Citizenship Status (2024)
Place of birth and citizenship status analysis for Providence County, Rhode Island
Providence County, Rhode Island Nativity & Citizenship Indicators (2024)
Native Born
79.1%
Foreign Born
20.9%
Naturalized
11.0%
US Citizens
90.1%
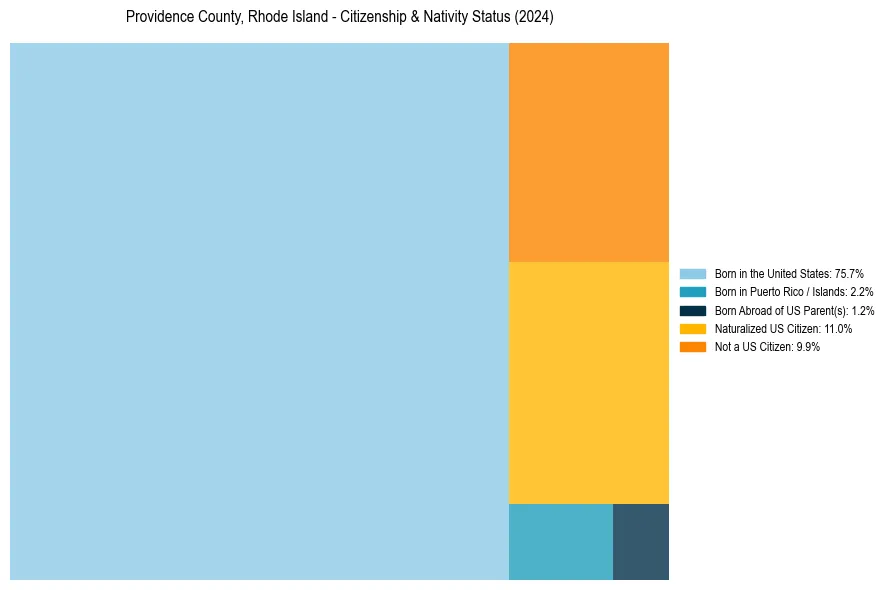
Providence County, Rhode Island Nativity & Citizenship Distribution
Providence County, Rhode Island Historical Nativity Trends (2010–2024)
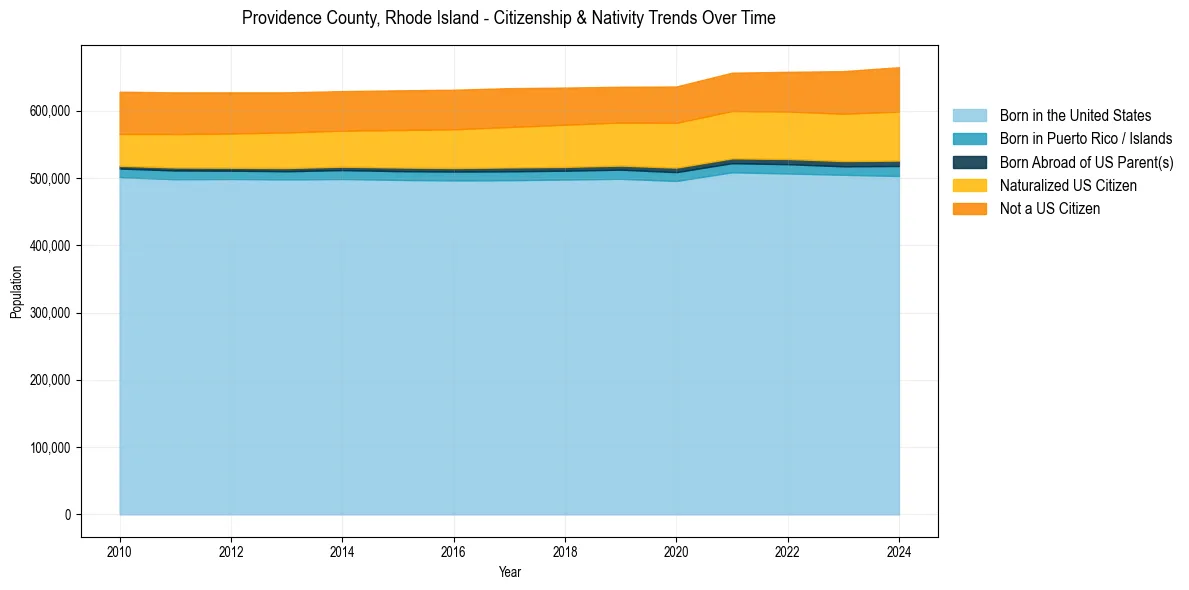
Providence County, Rhode Island Population & Nativity History
| Year | Total Pop | Foreign Born | Native Born |
|---|---|---|---|
| 2024 | 664,854 | 20.9% | 79.1% |
| 2023 | 658,977 | 20.3% | 79.7% |
| 2022 | 657,984 | 19.7% | 80.3% |
| 2021 | 656,672 | 19.4% | 80.6% |
| 2020 | 636,161 | 19.0% | 81.0% |
| 2019 | 635,737 | 18.4% | 81.6% |
| 2018 | 634,533 | 18.6% | 81.4% |
| 2017 | 633,704 | 18.6% | 81.4% |
| 2016 | 631,344 | 18.5% | 81.5% |
| 2015 | 630,459 | 18.2% | 81.8% |
| 2014 | 629,280 | 17.9% | 82.1% |
| 2013 | 627,469 | 17.9% | 82.1% |
| 2012 | 627,414 | 17.9% | 82.1% |
| 2011 | 627,362 | 17.8% | 82.2% |
| 2010 | 628,413 | 17.5% | 82.5% |
Nativity & Citizenship FAQs for Providence County, Rhode Island
Approximately 20.9% of residents in Providence County, Rhode Island were born outside the United States.
The vast majority of residents, roughly 90.1%, are U.S. citizens (including both native-born and naturalized citizens).