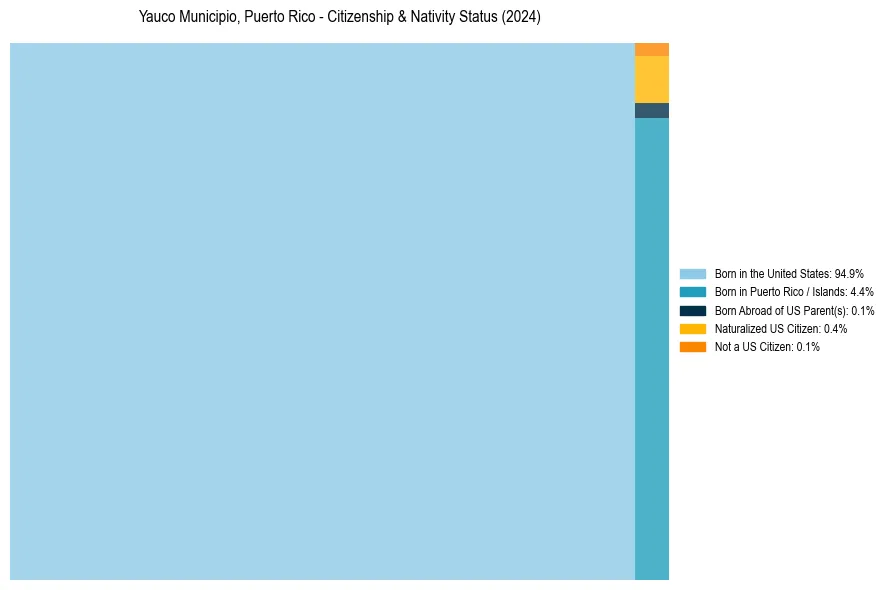
Yauco Municipio, Puerto Rico Nativity & Citizenship Status (2024)
Place of birth and citizenship status analysis for Yauco Municipio, Puerto Rico
Yauco Municipio, Puerto Rico Nativity & Citizenship Indicators (2024)
Native Born
99.4%
Foreign Born
0.6%
Naturalized
0.4%
US Citizens
99.9%
Yauco Municipio, Puerto Rico Nativity & Citizenship Distribution
Yauco Municipio, Puerto Rico Historical Nativity Trends (2010–2024)
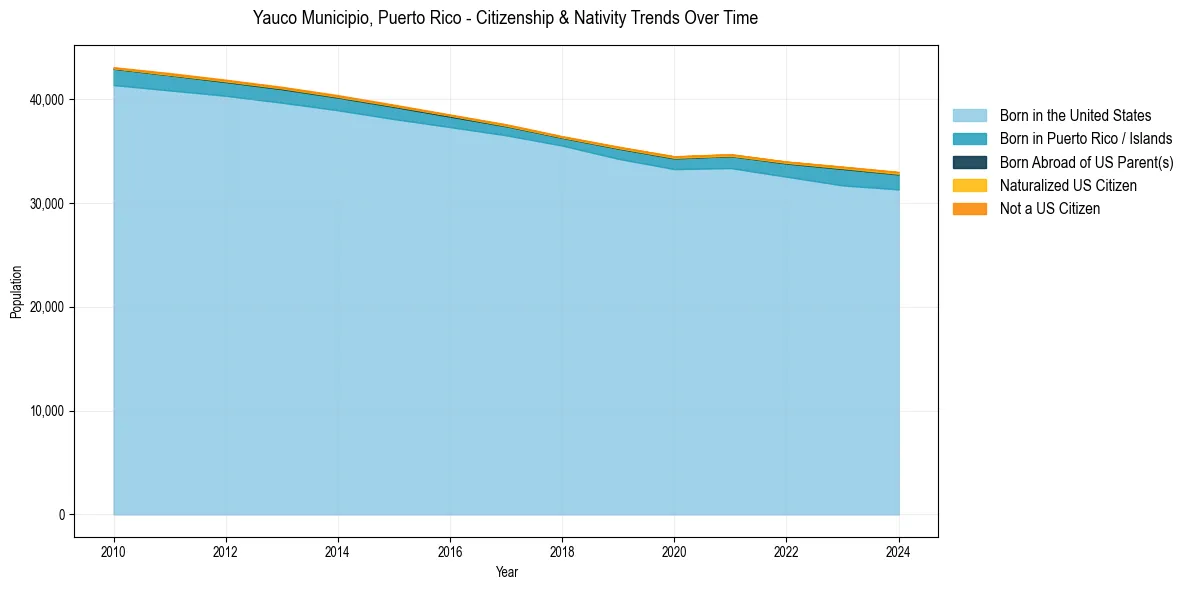
Yauco Municipio, Puerto Rico Population & Nativity History
| Year | Total Pop | Foreign Born | Native Born |
|---|---|---|---|
| 2024 | 32,993 | 0.6% | 99.4% |
| 2023 | 33,509 | 0.5% | 99.5% |
| 2022 | 33,988 | 0.4% | 99.6% |
| 2021 | 34,704 | 0.5% | 99.5% |
| 2020 | 34,501 | 0.5% | 99.5% |
| 2019 | 35,428 | 0.4% | 99.6% |
| 2018 | 36,439 | 0.3% | 99.7% |
| 2017 | 37,585 | 0.4% | 99.6% |
| 2016 | 38,519 | 0.3% | 99.7% |
| 2015 | 39,474 | 0.4% | 99.6% |
| 2014 | 40,391 | 0.4% | 99.6% |
| 2013 | 41,194 | 0.4% | 99.6% |
| 2012 | 41,876 | 0.4% | 99.6% |
| 2011 | 42,516 | 0.4% | 99.6% |
| 2010 | 43,082 | 0.3% | 99.7% |
Nativity & Citizenship FAQs for Yauco Municipio, Puerto Rico
Approximately 0.6% of residents in Yauco Municipio, Puerto Rico were born outside the United States.
The vast majority of residents, roughly 99.9%, are U.S. citizens (including both native-born and naturalized citizens).