Villalba Municipio, Puerto Rico Nativity & Citizenship Status (2024)
Place of birth and citizenship status analysis for Villalba Municipio, Puerto Rico
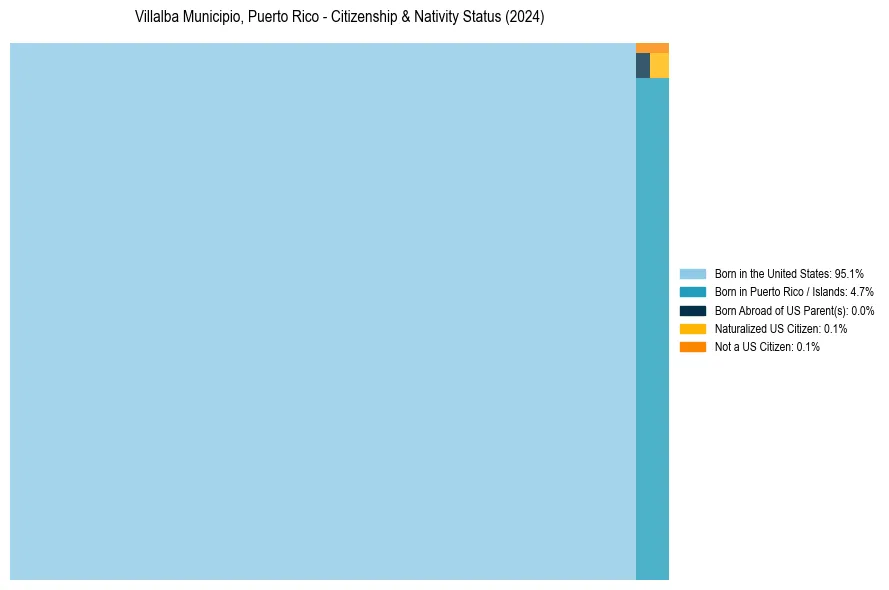
Villalba Municipio, Puerto Rico Nativity & Citizenship Indicators (2024)
Native Born
99.8%
Foreign Born
0.2%
Naturalized
0.1%
US Citizens
99.9%
Villalba Municipio, Puerto Rico Nativity & Citizenship Distribution
Villalba Municipio, Puerto Rico Historical Nativity Trends (2010–2024)
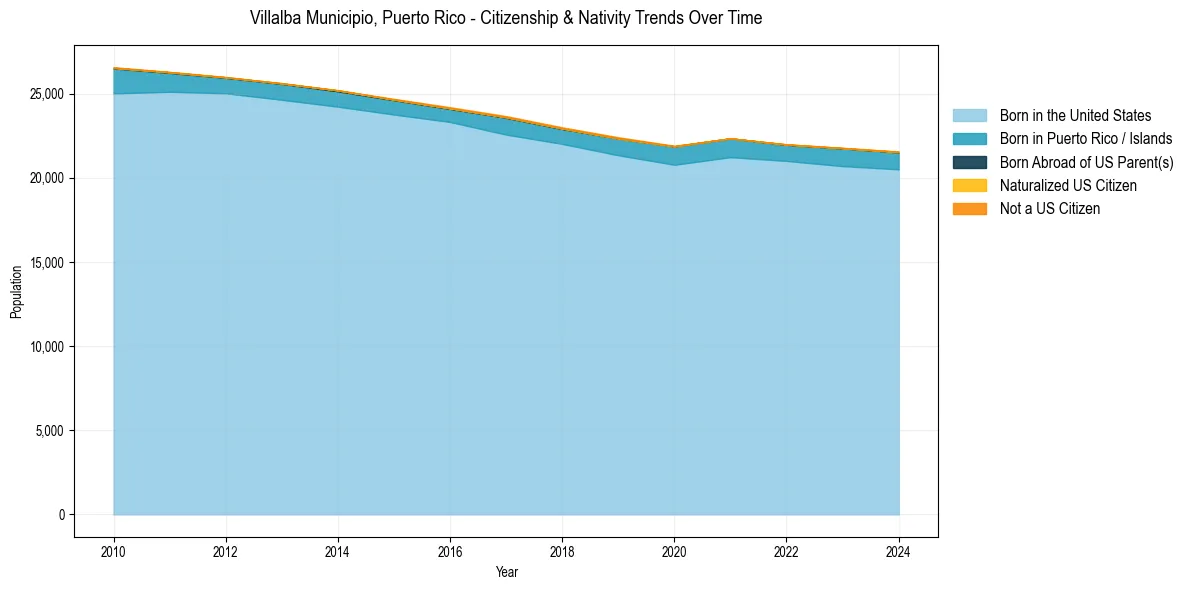
Villalba Municipio, Puerto Rico Population & Nativity History
| Year | Total Pop | Foreign Born | Native Born |
|---|---|---|---|
| 2024 | 21,556 | 0.2% | 99.8% |
| 2023 | 21,778 | 0.2% | 99.8% |
| 2022 | 21,984 | 0.1% | 99.9% |
| 2021 | 22,341 | 0.0% | 100.0% |
| 2020 | 21,899 | 0.2% | 99.8% |
| 2019 | 22,403 | 0.3% | 99.7% |
| 2018 | 22,993 | 0.3% | 99.7% |
| 2017 | 23,659 | 0.3% | 99.7% |
| 2016 | 24,186 | 0.3% | 99.7% |
| 2015 | 24,685 | 0.2% | 99.8% |
| 2014 | 25,196 | 0.1% | 99.9% |
| 2013 | 25,618 | 0.1% | 99.9% |
| 2012 | 25,983 | 0.1% | 99.9% |
| 2011 | 26,290 | 0.1% | 99.9% |
| 2010 | 26,565 | 0.1% | 99.9% |
Nativity & Citizenship FAQs for Villalba Municipio, Puerto Rico
Approximately 0.2% of residents in Villalba Municipio, Puerto Rico were born outside the United States.
The vast majority of residents, roughly 99.9%, are U.S. citizens (including both native-born and naturalized citizens).