Vega Baja Municipio, Puerto Rico Nativity & Citizenship Status (2024)
Place of birth and citizenship status analysis for Vega Baja Municipio, Puerto Rico
Vega Baja Municipio, Puerto Rico Nativity & Citizenship Indicators (2024)
Native Born
99.2%
Foreign Born
0.8%
Naturalized
0.4%
US Citizens
99.6%
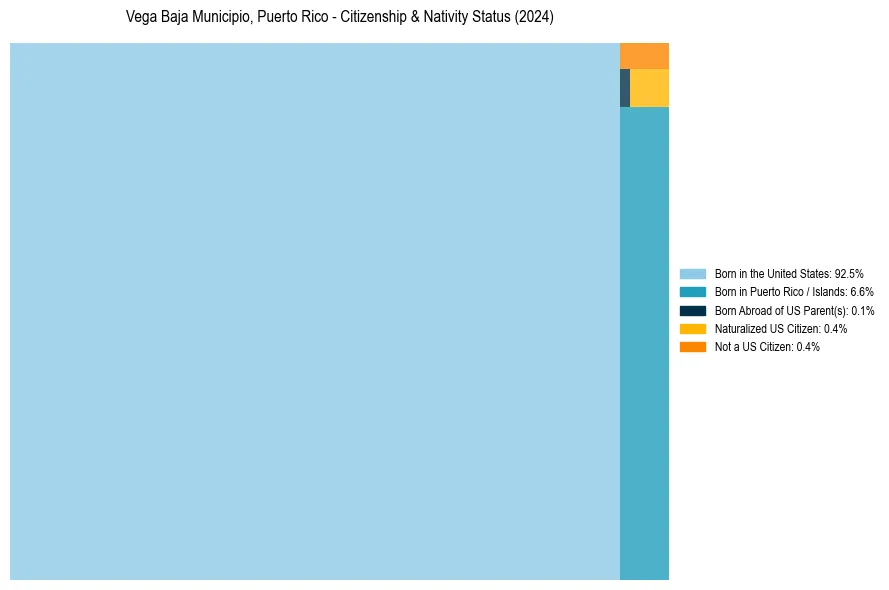
Vega Baja Municipio, Puerto Rico Nativity & Citizenship Distribution
Vega Baja Municipio, Puerto Rico Historical Nativity Trends (2010–2024)
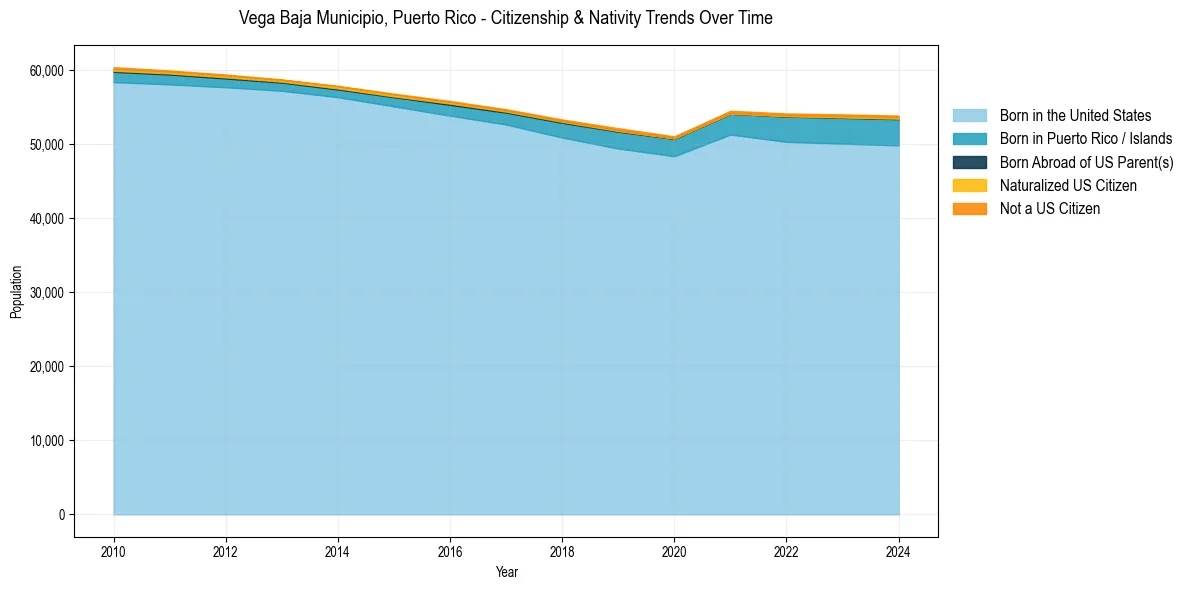
Vega Baja Municipio, Puerto Rico Population & Nativity History
| Year | Total Pop | Foreign Born | Native Born |
|---|---|---|---|
| 2024 | 53,892 | 0.8% | 99.2% |
| 2023 | 54,058 | 0.8% | 99.2% |
| 2022 | 54,182 | 0.7% | 99.3% |
| 2021 | 54,544 | 0.7% | 99.3% |
| 2020 | 51,089 | 0.6% | 99.4% |
| 2019 | 52,192 | 0.7% | 99.3% |
| 2018 | 53,371 | 0.6% | 99.4% |
| 2017 | 54,754 | 0.6% | 99.4% |
| 2016 | 55,866 | 0.6% | 99.4% |
| 2015 | 56,858 | 0.7% | 99.3% |
| 2014 | 57,915 | 0.6% | 99.4% |
| 2013 | 58,782 | 0.5% | 99.5% |
| 2012 | 59,444 | 0.6% | 99.4% |
| 2011 | 59,995 | 0.7% | 99.3% |
| 2010 | 60,436 | 0.8% | 99.2% |
Nativity & Citizenship FAQs for Vega Baja Municipio, Puerto Rico
Approximately 0.8% of residents in Vega Baja Municipio, Puerto Rico were born outside the United States.
The vast majority of residents, roughly 99.6%, are U.S. citizens (including both native-born and naturalized citizens).