San Juan Municipio, Puerto Rico Nativity & Citizenship Status (2024)
Place of birth and citizenship status analysis for San Juan Municipio, Puerto Rico
San Juan Municipio, Puerto Rico Nativity & Citizenship Indicators (2024)
Native Born
89.5%
Foreign Born
10.5%
Naturalized
5.3%
US Citizens
94.8%
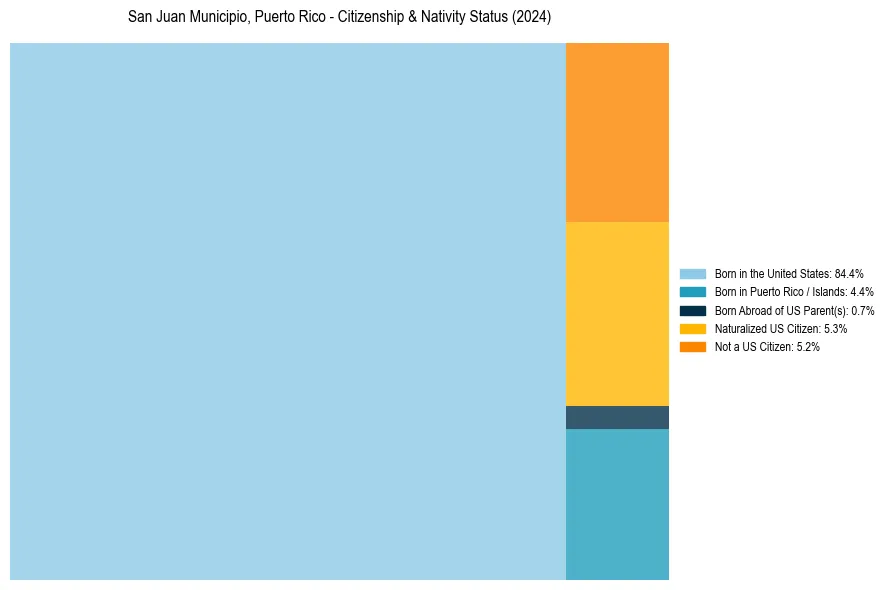
San Juan Municipio, Puerto Rico Nativity & Citizenship Distribution
San Juan Municipio, Puerto Rico Historical Nativity Trends (2010–2024)
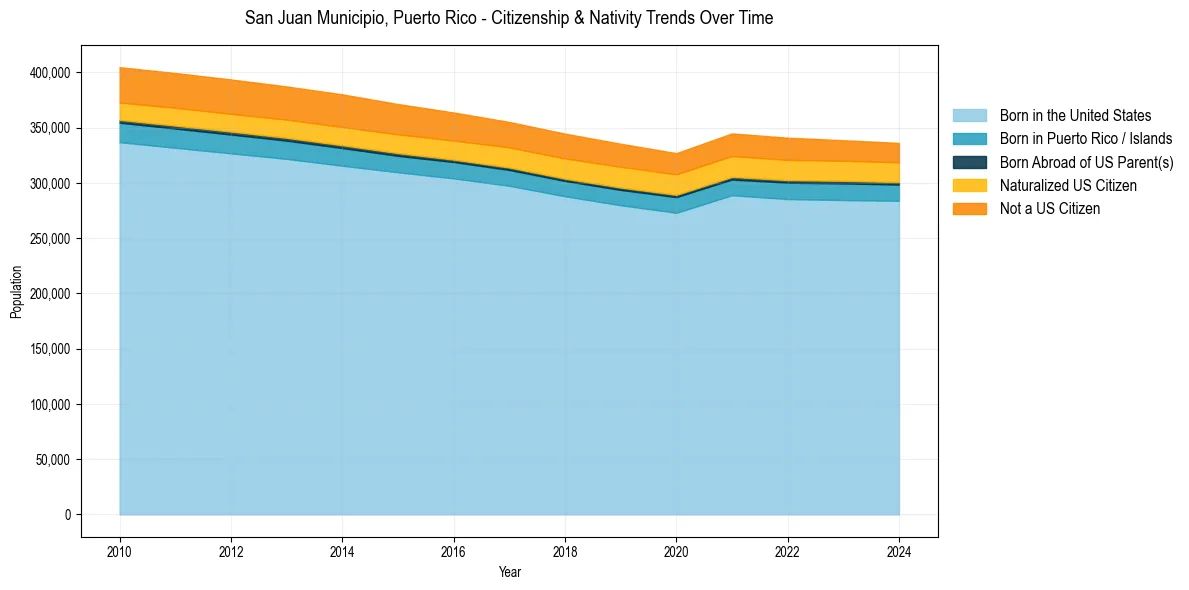
San Juan Municipio, Puerto Rico Population & Nativity History
| Year | Total Pop | Foreign Born | Native Born |
|---|---|---|---|
| 2024 | 336,160 | 10.5% | 89.5% |
| 2023 | 338,661 | 10.9% | 89.1% |
| 2022 | 340,903 | 11.3% | 88.7% |
| 2021 | 344,791 | 11.4% | 88.6% |
| 2020 | 326,953 | 11.5% | 88.5% |
| 2019 | 335,468 | 11.8% | 88.2% |
| 2018 | 344,606 | 11.8% | 88.2% |
| 2017 | 355,181 | 11.6% | 88.4% |
| 2016 | 363,744 | 11.7% | 88.3% |
| 2015 | 371,400 | 12.0% | 88.0% |
| 2014 | 380,149 | 12.1% | 87.9% |
| 2013 | 387,336 | 12.0% | 88.0% |
| 2012 | 393,633 | 12.0% | 88.0% |
| 2011 | 399,474 | 11.9% | 88.1% |
| 2010 | 404,748 | 11.8% | 88.2% |
Nativity & Citizenship FAQs for San Juan Municipio, Puerto Rico
Approximately 10.5% of residents in San Juan Municipio, Puerto Rico were born outside the United States.
The vast majority of residents, roughly 94.8%, are U.S. citizens (including both native-born and naturalized citizens).