Ponce Municipio, Puerto Rico Nativity & Citizenship Status (2024)
Place of birth and citizenship status analysis for Ponce Municipio, Puerto Rico
Ponce Municipio, Puerto Rico Nativity & Citizenship Indicators (2024)
Native Born
99.0%
Foreign Born
1.0%
Naturalized
0.4%
US Citizens
99.4%
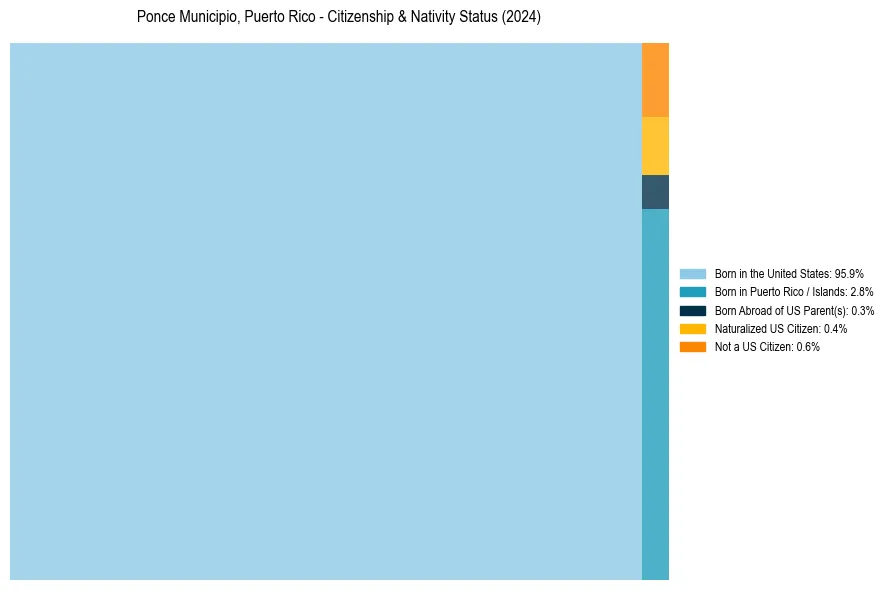
Ponce Municipio, Puerto Rico Nativity & Citizenship Distribution
Ponce Municipio, Puerto Rico Historical Nativity Trends (2010–2024)
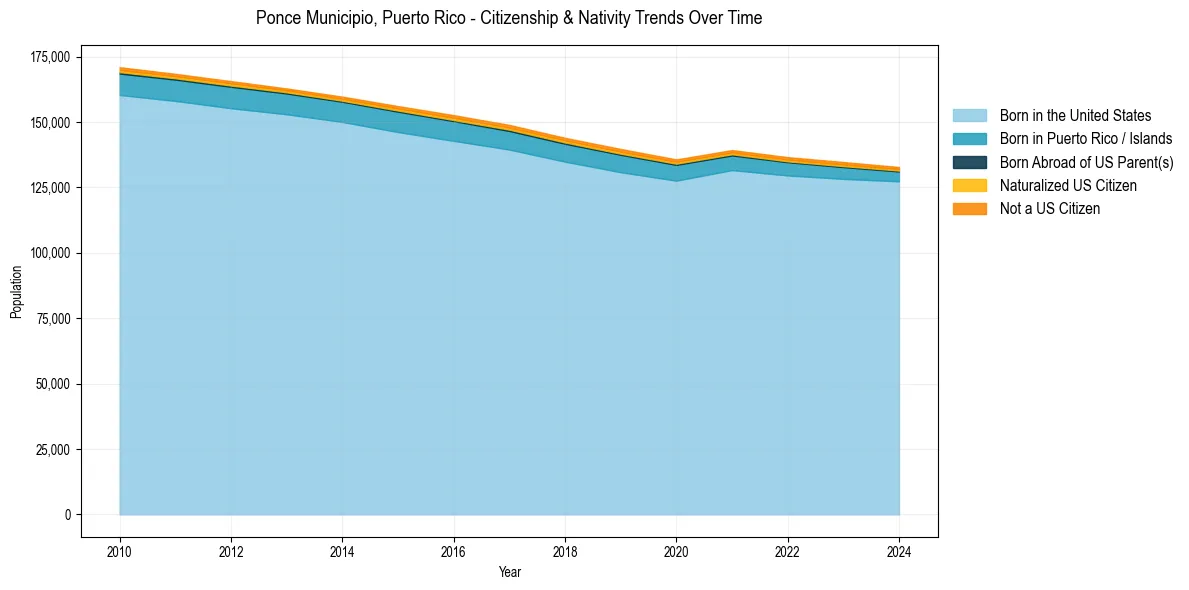
Ponce Municipio, Puerto Rico Population & Nativity History
| Year | Total Pop | Foreign Born | Native Born |
|---|---|---|---|
| 2024 | 132,760 | 1.0% | 99.0% |
| 2023 | 134,676 | 1.2% | 98.8% |
| 2022 | 136,542 | 1.2% | 98.8% |
| 2021 | 139,245 | 1.1% | 98.9% |
| 2020 | 135,674 | 1.2% | 98.8% |
| 2019 | 139,671 | 1.3% | 98.7% |
| 2018 | 143,926 | 1.2% | 98.8% |
| 2017 | 148,863 | 1.2% | 98.8% |
| 2016 | 152,594 | 1.2% | 98.8% |
| 2015 | 156,054 | 1.1% | 98.9% |
| 2014 | 159,660 | 1.0% | 99.0% |
| 2013 | 162,793 | 0.9% | 99.1% |
| 2012 | 165,602 | 1.0% | 99.0% |
| 2011 | 168,382 | 1.0% | 99.0% |
| 2010 | 170,920 | 1.1% | 98.9% |
Nativity & Citizenship FAQs for Ponce Municipio, Puerto Rico
Approximately 1.0% of residents in Ponce Municipio, Puerto Rico were born outside the United States.
The vast majority of residents, roughly 99.4%, are U.S. citizens (including both native-born and naturalized citizens).