Patillas Municipio, Puerto Rico Nativity & Citizenship Status (2024)
Place of birth and citizenship status analysis for Patillas Municipio, Puerto Rico
Patillas Municipio, Puerto Rico Nativity & Citizenship Indicators (2024)
Native Born
99.7%
Foreign Born
0.3%
Naturalized
0.0%
US Citizens
99.7%
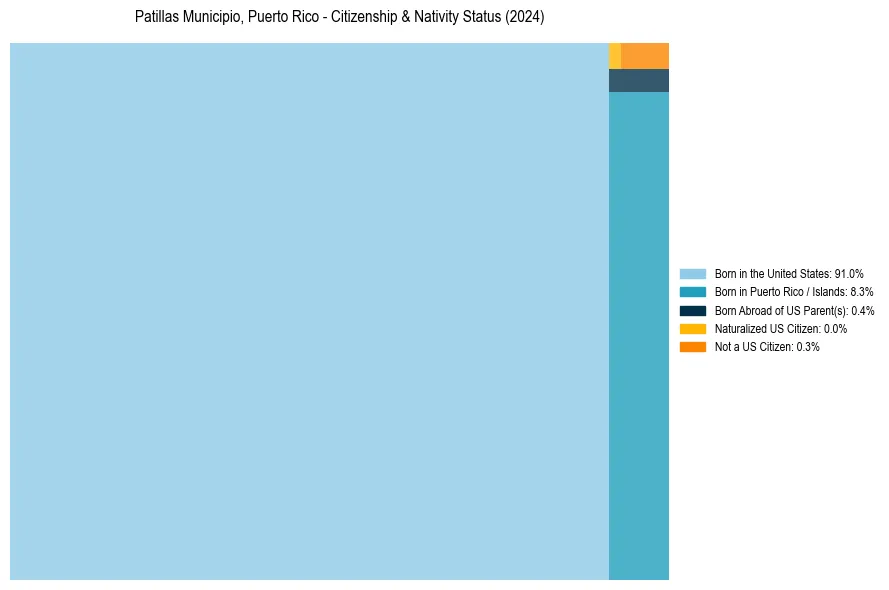
Patillas Municipio, Puerto Rico Nativity & Citizenship Distribution
Patillas Municipio, Puerto Rico Historical Nativity Trends (2010–2024)

Patillas Municipio, Puerto Rico Population & Nativity History
| Year | Total Pop | Foreign Born | Native Born |
|---|---|---|---|
| 2024 | 15,563 | 0.3% | 99.7% |
| 2023 | 15,753 | 0.3% | 99.7% |
| 2022 | 15,927 | 0.6% | 99.4% |
| 2021 | 16,231 | 0.6% | 99.4% |
| 2020 | 16,591 | 0.8% | 99.2% |
| 2019 | 16,929 | 0.6% | 99.4% |
| 2018 | 17,334 | 0.6% | 99.4% |
| 2017 | 17,769 | 0.7% | 99.3% |
| 2016 | 18,135 | 0.8% | 99.2% |
| 2015 | 18,441 | 0.5% | 99.5% |
| 2014 | 18,766 | 0.3% | 99.7% |
| 2013 | 19,017 | 0.3% | 99.7% |
| 2012 | 19,225 | 0.2% | 99.8% |
| 2011 | 19,397 | 0.2% | 99.8% |
| 2010 | 19,552 | 0.4% | 99.6% |
Nativity & Citizenship FAQs for Patillas Municipio, Puerto Rico
Approximately 0.3% of residents in Patillas Municipio, Puerto Rico were born outside the United States.
The vast majority of residents, roughly 99.7%, are U.S. citizens (including both native-born and naturalized citizens).