Naranjito Municipio, Puerto Rico Nativity & Citizenship Status (2024)
Place of birth and citizenship status analysis for Naranjito Municipio, Puerto Rico
Naranjito Municipio, Puerto Rico Nativity & Citizenship Indicators (2024)
Native Born
99.8%
Foreign Born
0.2%
Naturalized
0.2%
US Citizens
100.0%
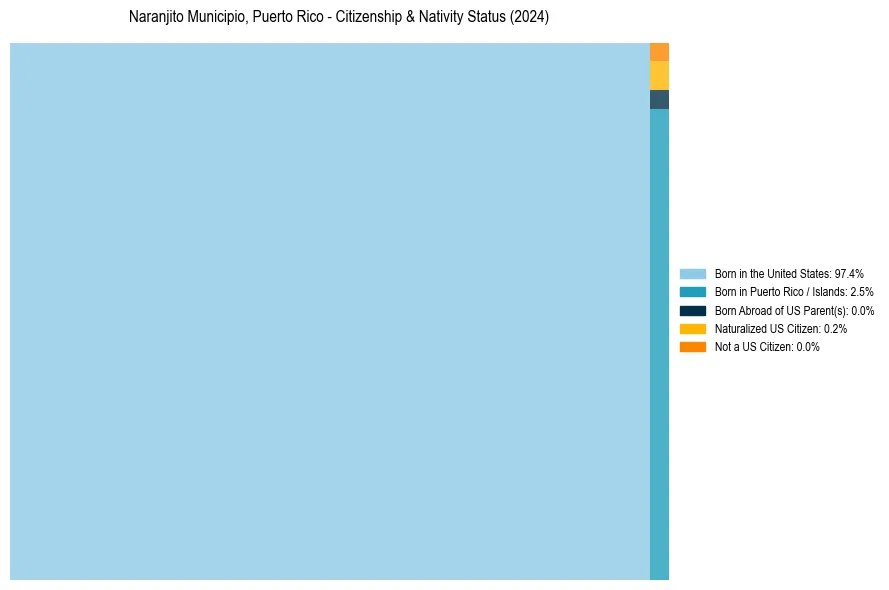
Naranjito Municipio, Puerto Rico Nativity & Citizenship Distribution
Naranjito Municipio, Puerto Rico Historical Nativity Trends (2010–2024)
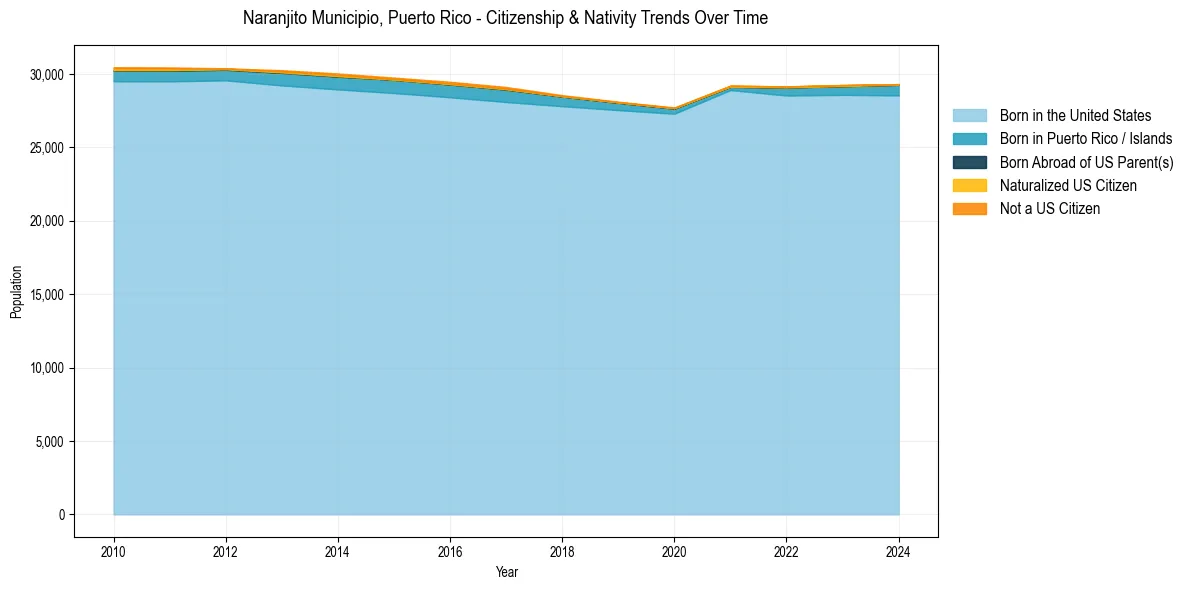
Naranjito Municipio, Puerto Rico Population & Nativity History
| Year | Total Pop | Foreign Born | Native Born |
|---|---|---|---|
| 2024 | 29,310 | 0.2% | 99.8% |
| 2023 | 29,246 | 0.3% | 99.7% |
| 2022 | 29,153 | 0.3% | 99.7% |
| 2021 | 29,200 | 0.3% | 99.7% |
| 2020 | 27,719 | 0.2% | 99.8% |
| 2019 | 28,112 | 0.2% | 99.8% |
| 2018 | 28,557 | 0.3% | 99.7% |
| 2017 | 29,112 | 0.6% | 99.4% |
| 2016 | 29,467 | 0.6% | 99.4% |
| 2015 | 29,751 | 0.5% | 99.5% |
| 2014 | 30,034 | 0.6% | 99.4% |
| 2013 | 30,256 | 0.5% | 99.5% |
| 2012 | 30,385 | 0.2% | 99.8% |
| 2011 | 30,442 | 0.6% | 99.4% |
| 2010 | 30,460 | 0.7% | 99.3% |
Nativity & Citizenship FAQs for Naranjito Municipio, Puerto Rico
Approximately 0.2% of residents in Naranjito Municipio, Puerto Rico were born outside the United States.
The vast majority of residents, roughly 100.0%, are U.S. citizens (including both native-born and naturalized citizens).