Maunabo Municipio, Puerto Rico Nativity & Citizenship Status (2024)
Place of birth and citizenship status analysis for Maunabo Municipio, Puerto Rico
Maunabo Municipio, Puerto Rico Nativity & Citizenship Indicators (2024)
Native Born
98.9%
Foreign Born
1.1%
Naturalized
0.6%
US Citizens
99.5%
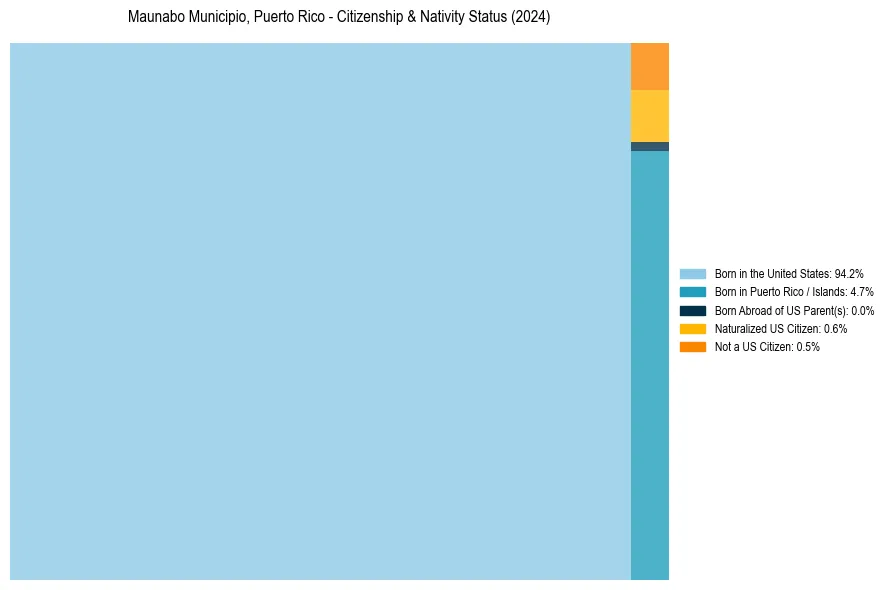
Maunabo Municipio, Puerto Rico Nativity & Citizenship Distribution
Maunabo Municipio, Puerto Rico Historical Nativity Trends (2010–2024)
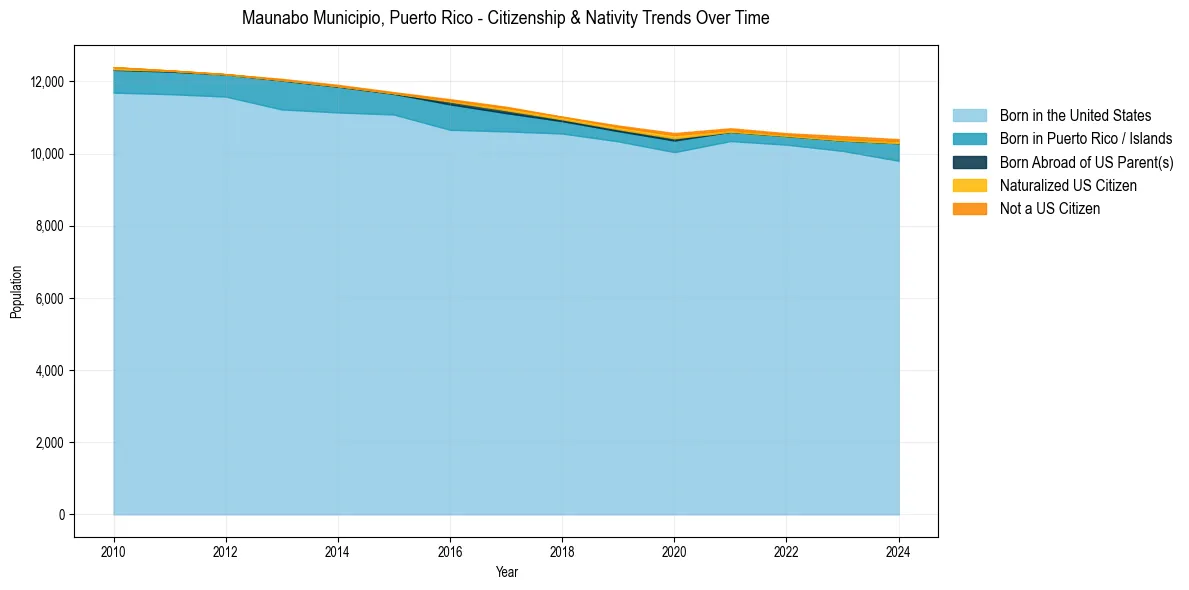
Maunabo Municipio, Puerto Rico Population & Nativity History
| Year | Total Pop | Foreign Born | Native Born |
|---|---|---|---|
| 2024 | 10,399 | 1.1% | 98.9% |
| 2023 | 10,482 | 1.1% | 98.9% |
| 2022 | 10,563 | 0.7% | 99.3% |
| 2021 | 10,700 | 0.9% | 99.1% |
| 2020 | 10,568 | 1.4% | 98.6% |
| 2019 | 10,776 | 0.9% | 99.1% |
| 2018 | 11,023 | 0.7% | 99.3% |
| 2017 | 11,297 | 0.9% | 99.1% |
| 2016 | 11,506 | 0.6% | 99.4% |
| 2015 | 11,701 | 0.3% | 99.7% |
| 2014 | 11,904 | 0.3% | 99.7% |
| 2013 | 12,070 | 0.3% | 99.7% |
| 2012 | 12,201 | 0.0% | 100.0% |
| 2011 | 12,304 | 0.1% | 99.9% |
| 2010 | 12,393 | 0.5% | 99.5% |
Nativity & Citizenship FAQs for Maunabo Municipio, Puerto Rico
Approximately 1.1% of residents in Maunabo Municipio, Puerto Rico were born outside the United States.
The vast majority of residents, roughly 99.5%, are U.S. citizens (including both native-born and naturalized citizens).