Las Piedras Municipio, Puerto Rico Nativity & Citizenship Status (2024)
Place of birth and citizenship status analysis for Las Piedras Municipio, Puerto Rico
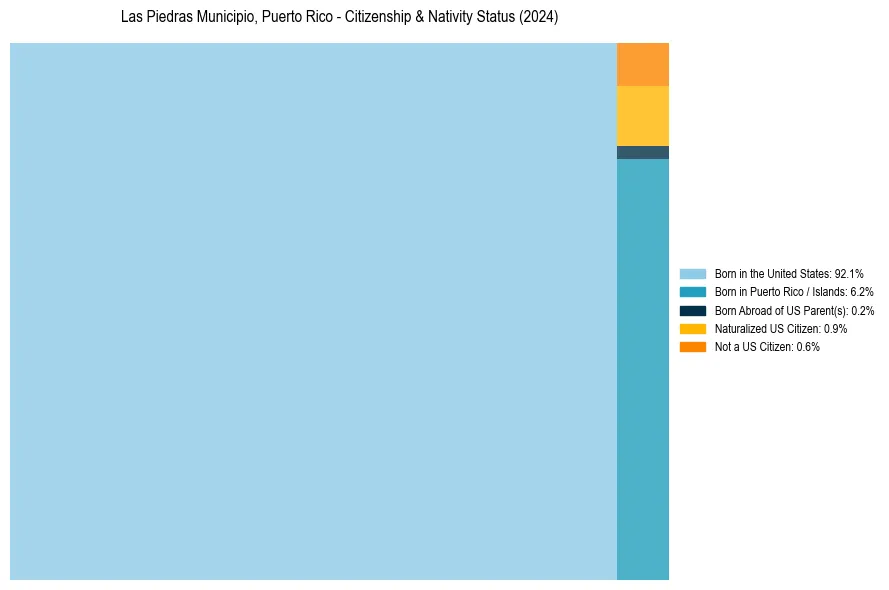
Las Piedras Municipio, Puerto Rico Nativity & Citizenship Indicators (2024)
Native Born
98.5%
Foreign Born
1.5%
Naturalized
0.9%
US Citizens
99.4%
Las Piedras Municipio, Puerto Rico Nativity & Citizenship Distribution
Las Piedras Municipio, Puerto Rico Historical Nativity Trends (2010–2024)
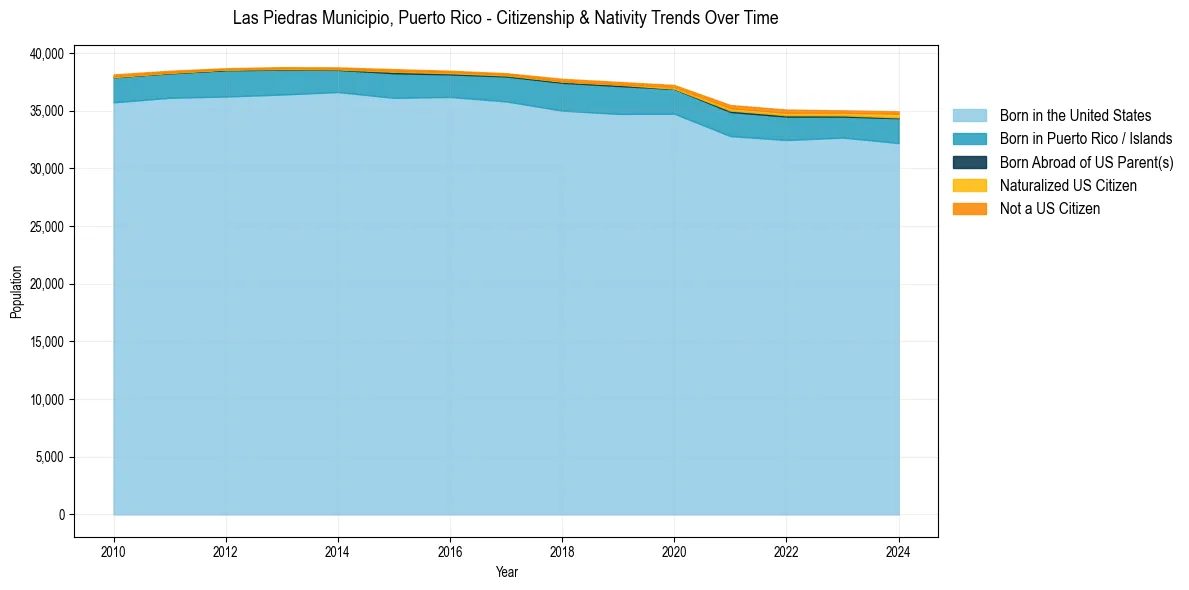
Las Piedras Municipio, Puerto Rico Population & Nativity History
| Year | Total Pop | Foreign Born | Native Born |
|---|---|---|---|
| 2024 | 34,951 | 1.5% | 98.5% |
| 2023 | 35,034 | 1.2% | 98.8% |
| 2022 | 35,099 | 1.4% | 98.6% |
| 2021 | 35,495 | 1.3% | 98.7% |
| 2020 | 37,233 | 0.9% | 99.1% |
| 2019 | 37,499 | 0.6% | 99.4% |
| 2018 | 37,768 | 0.7% | 99.3% |
| 2017 | 38,253 | 0.5% | 99.5% |
| 2016 | 38,466 | 0.6% | 99.4% |
| 2015 | 38,605 | 0.6% | 99.4% |
| 2014 | 38,759 | 0.4% | 99.6% |
| 2013 | 38,777 | 0.4% | 99.6% |
| 2012 | 38,687 | 0.3% | 99.7% |
| 2011 | 38,466 | 0.5% | 99.5% |
| 2010 | 38,146 | 0.6% | 99.4% |
Nativity & Citizenship FAQs for Las Piedras Municipio, Puerto Rico
Approximately 1.5% of residents in Las Piedras Municipio, Puerto Rico were born outside the United States.
The vast majority of residents, roughly 99.4%, are U.S. citizens (including both native-born and naturalized citizens).