Guaynabo Municipio, Puerto Rico Nativity & Citizenship Status (2024)
Place of birth and citizenship status analysis for Guaynabo Municipio, Puerto Rico
Guaynabo Municipio, Puerto Rico Nativity & Citizenship Indicators (2024)
Native Born
93.4%
Foreign Born
6.6%
Naturalized
3.5%
US Citizens
97.0%
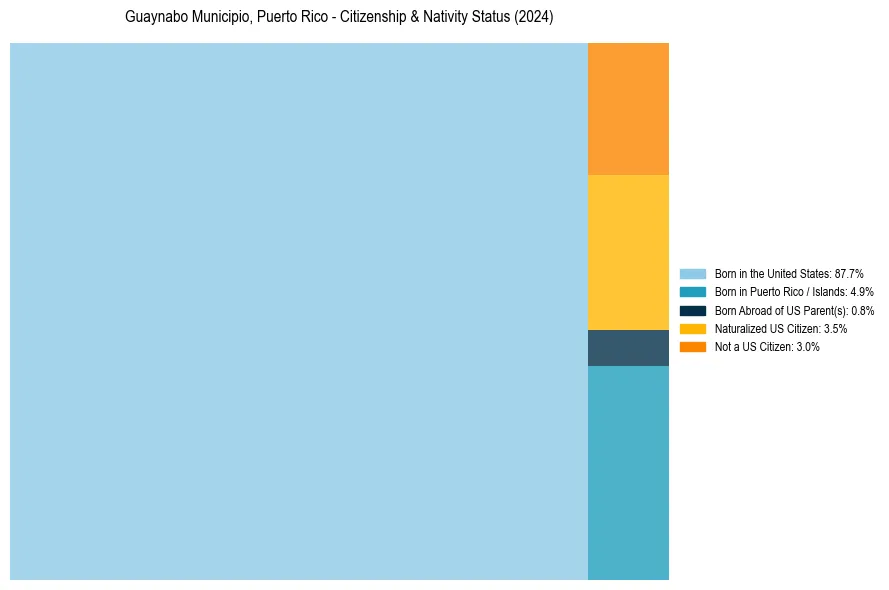
Guaynabo Municipio, Puerto Rico Nativity & Citizenship Distribution
Guaynabo Municipio, Puerto Rico Historical Nativity Trends (2010–2024)
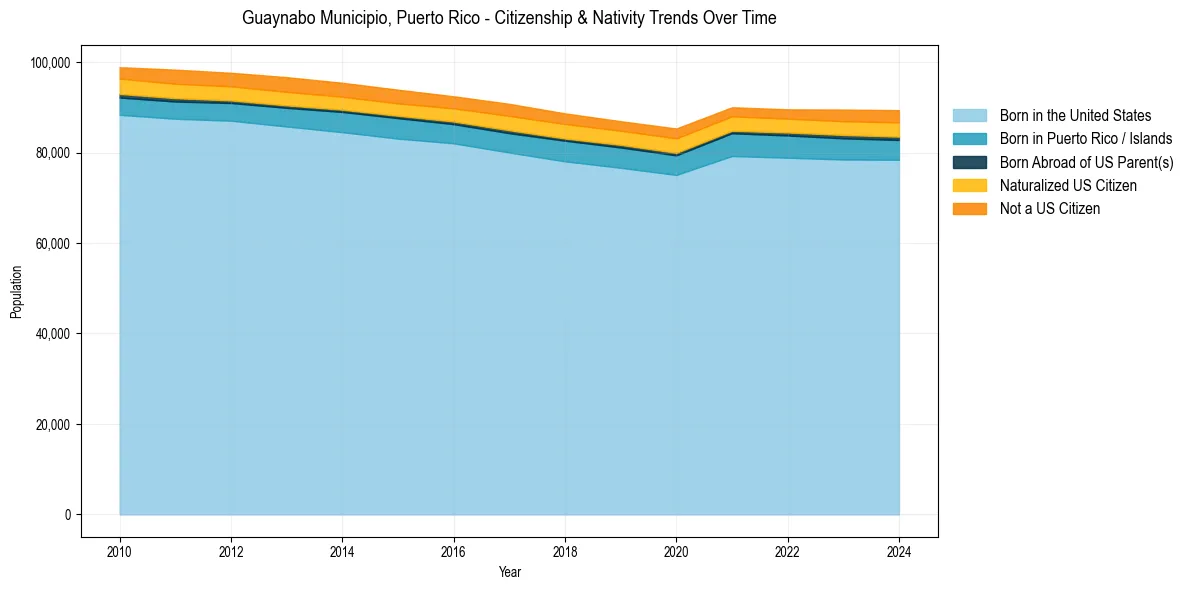
Guaynabo Municipio, Puerto Rico Population & Nativity History
| Year | Total Pop | Foreign Born | Native Born |
|---|---|---|---|
| 2024 | 89,378 | 6.6% | 93.4% |
| 2023 | 89,503 | 6.3% | 93.7% |
| 2022 | 89,554 | 5.7% | 94.3% |
| 2021 | 90,014 | 5.8% | 94.2% |
| 2020 | 85,312 | 6.3% | 93.7% |
| 2019 | 86,937 | 6.0% | 94.0% |
| 2018 | 88,663 | 6.3% | 93.7% |
| 2017 | 90,773 | 6.4% | 93.6% |
| 2016 | 92,444 | 6.0% | 94.0% |
| 2015 | 93,899 | 6.1% | 93.9% |
| 2014 | 95,428 | 6.2% | 93.8% |
| 2013 | 96,670 | 6.5% | 93.5% |
| 2012 | 97,639 | 6.3% | 93.7% |
| 2011 | 98,326 | 6.4% | 93.6% |
| 2010 | 98,875 | 6.0% | 94.0% |
Nativity & Citizenship FAQs for Guaynabo Municipio, Puerto Rico
Approximately 6.6% of residents in Guaynabo Municipio, Puerto Rico were born outside the United States.
The vast majority of residents, roughly 97.0%, are U.S. citizens (including both native-born and naturalized citizens).