Cayey Municipio, Puerto Rico Nativity & Citizenship Status (2024)
Place of birth and citizenship status analysis for Cayey Municipio, Puerto Rico
Cayey Municipio, Puerto Rico Nativity & Citizenship Indicators (2024)
Native Born
99.3%
Foreign Born
0.7%
Naturalized
0.4%
US Citizens
99.8%
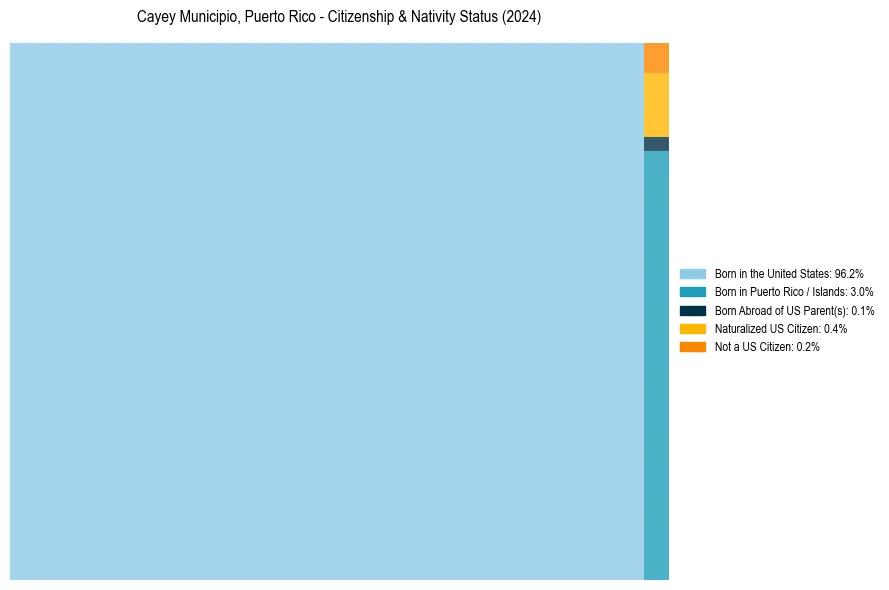
Cayey Municipio, Puerto Rico Nativity & Citizenship Distribution
Cayey Municipio, Puerto Rico Historical Nativity Trends (2010–2024)
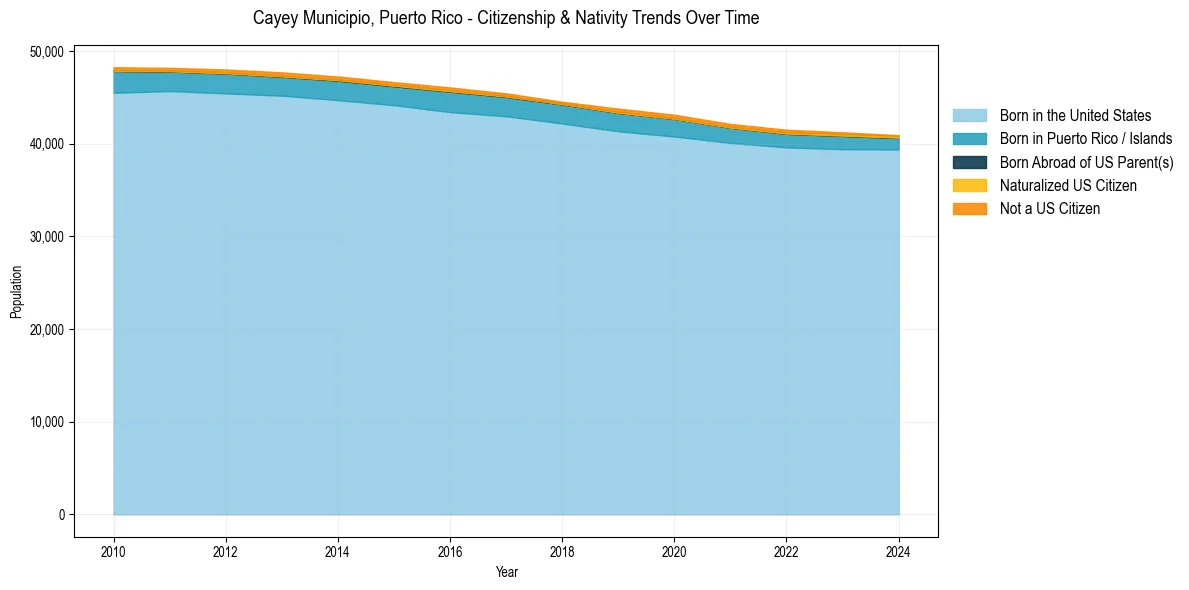
Cayey Municipio, Puerto Rico Population & Nativity History
| Year | Total Pop | Foreign Born | Native Born |
|---|---|---|---|
| 2024 | 40,917 | 0.7% | 99.3% |
| 2023 | 41,231 | 0.9% | 99.1% |
| 2022 | 41,509 | 1.0% | 99.0% |
| 2021 | 42,134 | 1.0% | 99.0% |
| 2020 | 43,126 | 1.0% | 99.0% |
| 2019 | 43,785 | 1.0% | 99.0% |
| 2018 | 44,530 | 0.6% | 99.4% |
| 2017 | 45,431 | 0.7% | 99.3% |
| 2016 | 46,071 | 0.9% | 99.1% |
| 2015 | 46,647 | 0.9% | 99.1% |
| 2014 | 47,252 | 0.9% | 99.1% |
| 2013 | 47,700 | 0.9% | 99.1% |
| 2012 | 48,008 | 0.9% | 99.1% |
| 2011 | 48,184 | 0.8% | 99.2% |
| 2010 | 48,255 | 0.8% | 99.2% |
Nativity & Citizenship FAQs for Cayey Municipio, Puerto Rico
Approximately 0.7% of residents in Cayey Municipio, Puerto Rico were born outside the United States.
The vast majority of residents, roughly 99.8%, are U.S. citizens (including both native-born and naturalized citizens).