Caguas Municipio, Puerto Rico Nativity & Citizenship Status (2024)
Place of birth and citizenship status analysis for Caguas Municipio, Puerto Rico
Caguas Municipio, Puerto Rico Nativity & Citizenship Indicators (2024)
Native Born
97.4%
Foreign Born
2.6%
Naturalized
1.3%
US Citizens
98.8%
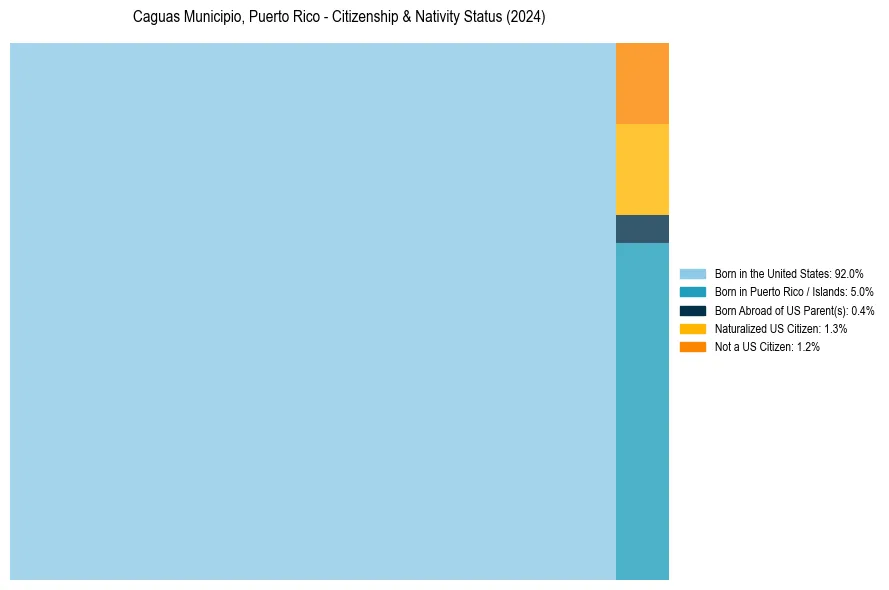
Caguas Municipio, Puerto Rico Nativity & Citizenship Distribution
Caguas Municipio, Puerto Rico Historical Nativity Trends (2010–2024)
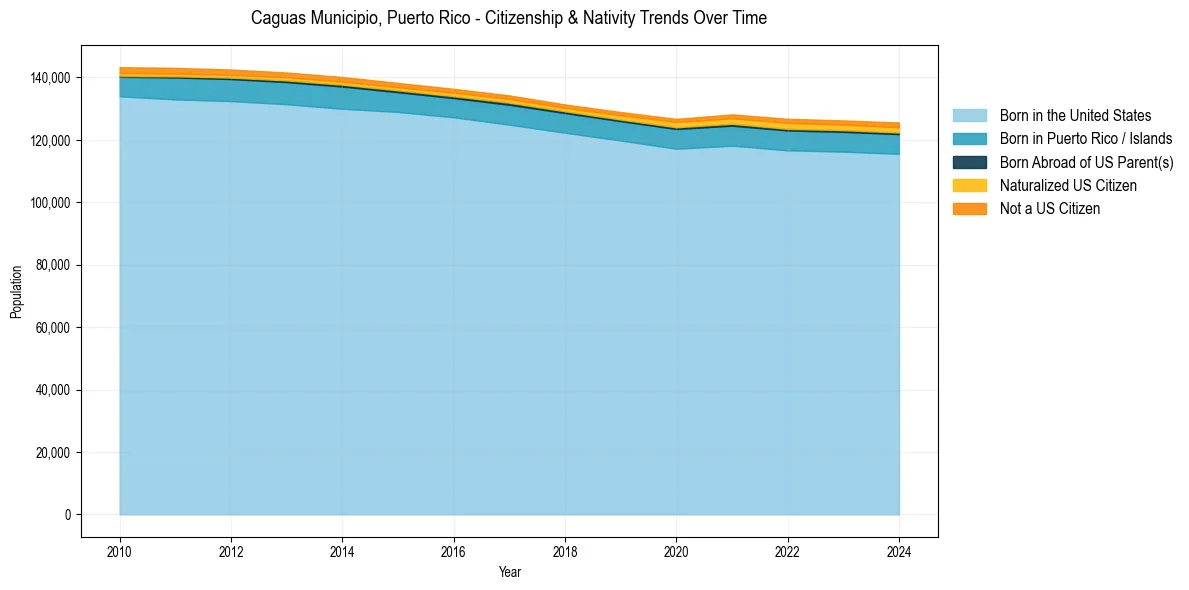
Caguas Municipio, Puerto Rico Population & Nativity History
| Year | Total Pop | Foreign Born | Native Born |
|---|---|---|---|
| 2024 | 125,586 | 2.6% | 97.4% |
| 2023 | 126,239 | 2.5% | 97.5% |
| 2022 | 126,772 | 2.5% | 97.5% |
| 2021 | 128,182 | 2.3% | 97.7% |
| 2020 | 126,734 | 2.1% | 97.9% |
| 2019 | 128,937 | 1.9% | 98.1% |
| 2018 | 131,363 | 1.7% | 98.3% |
| 2017 | 134,269 | 1.7% | 98.3% |
| 2016 | 136,372 | 1.7% | 98.3% |
| 2015 | 138,262 | 1.7% | 98.3% |
| 2014 | 140,166 | 1.8% | 98.2% |
| 2013 | 141,600 | 1.8% | 98.2% |
| 2012 | 142,549 | 1.8% | 98.2% |
| 2011 | 143,087 | 1.9% | 98.1% |
| 2010 | 143,301 | 1.9% | 98.1% |
Nativity & Citizenship FAQs for Caguas Municipio, Puerto Rico
Approximately 2.6% of residents in Caguas Municipio, Puerto Rico were born outside the United States.
The vast majority of residents, roughly 98.8%, are U.S. citizens (including both native-born and naturalized citizens).