Aibonito Municipio, Puerto Rico Nativity & Citizenship Status (2024)
Place of birth and citizenship status analysis for Aibonito Municipio, Puerto Rico
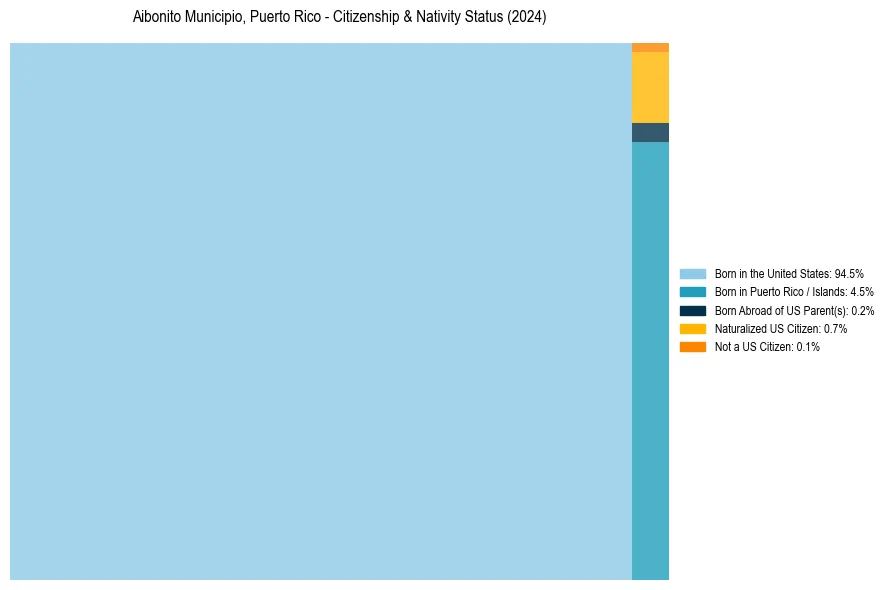
Aibonito Municipio, Puerto Rico Nativity & Citizenship Indicators (2024)
Native Born
99.2%
Foreign Born
0.8%
Naturalized
0.7%
US Citizens
99.9%
Aibonito Municipio, Puerto Rico Nativity & Citizenship Distribution
Aibonito Municipio, Puerto Rico Historical Nativity Trends (2010–2024)
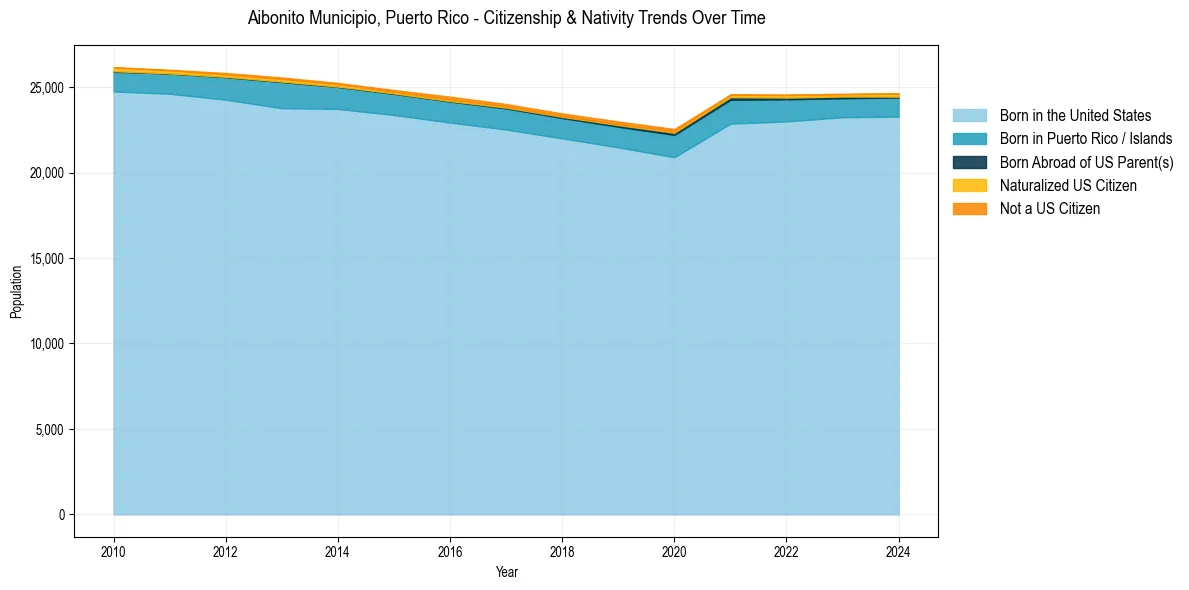
Aibonito Municipio, Puerto Rico Population & Nativity History
| Year | Total Pop | Foreign Born | Native Born |
|---|---|---|---|
| 2024 | 24,636 | 0.8% | 99.2% |
| 2023 | 24,610 | 0.7% | 99.3% |
| 2022 | 24,555 | 0.7% | 99.3% |
| 2021 | 24,565 | 0.6% | 99.4% |
| 2020 | 22,545 | 1.0% | 99.0% |
| 2019 | 22,988 | 0.9% | 99.1% |
| 2018 | 23,457 | 0.9% | 99.1% |
| 2017 | 24,008 | 0.9% | 99.1% |
| 2016 | 24,438 | 1.1% | 98.9% |
| 2015 | 24,829 | 0.8% | 99.2% |
| 2014 | 25,241 | 0.8% | 99.2% |
| 2013 | 25,560 | 0.9% | 99.1% |
| 2012 | 25,823 | 0.9% | 99.1% |
| 2011 | 26,011 | 0.8% | 99.2% |
| 2010 | 26,161 | 0.9% | 99.1% |
Nativity & Citizenship FAQs for Aibonito Municipio, Puerto Rico
Approximately 0.8% of residents in Aibonito Municipio, Puerto Rico were born outside the United States.
The vast majority of residents, roughly 99.9%, are U.S. citizens (including both native-born and naturalized citizens).