Wyoming County, Pennsylvania Nativity & Citizenship Status (2024)
Place of birth and citizenship status analysis for Wyoming County, Pennsylvania
Wyoming County, Pennsylvania Nativity & Citizenship Indicators (2024)
Native Born
98.3%
Foreign Born
1.7%
Naturalized
0.8%
US Citizens
99.1%
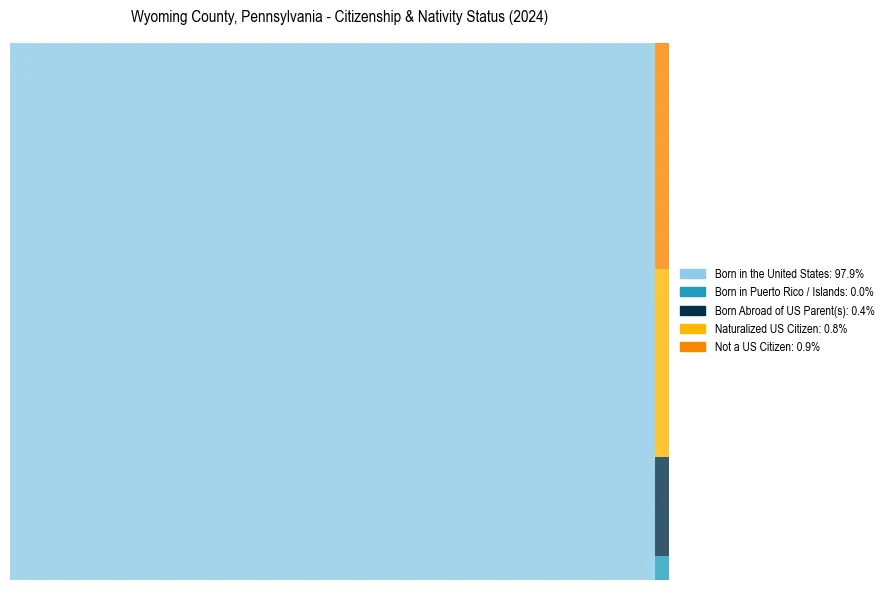
Wyoming County, Pennsylvania Nativity & Citizenship Distribution
Wyoming County, Pennsylvania Historical Nativity Trends (2010–2024)
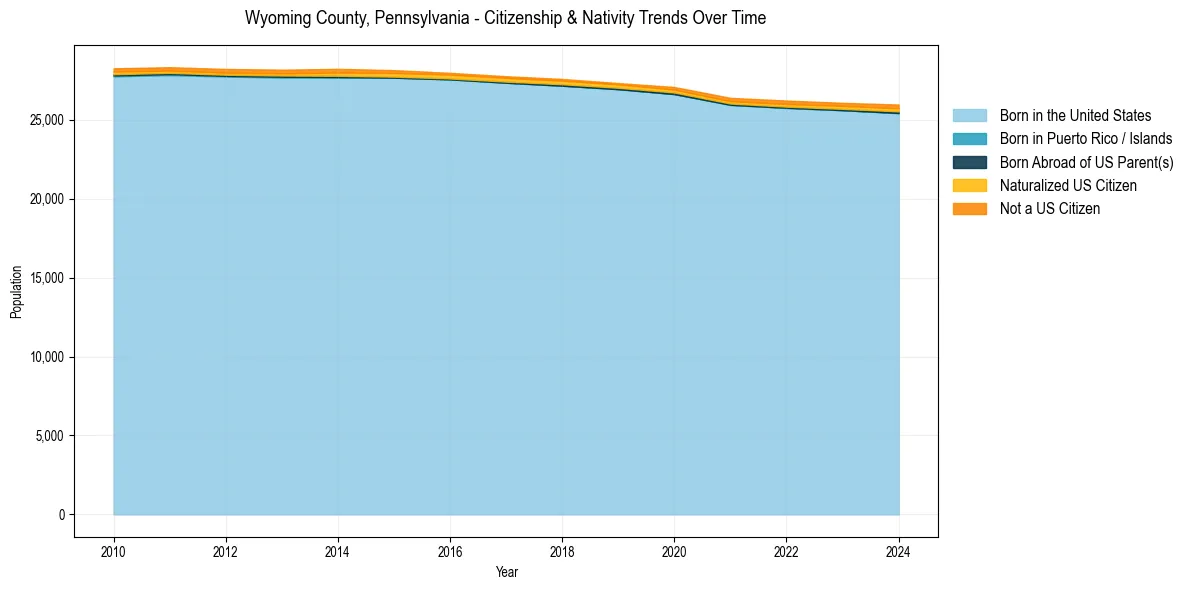
Wyoming County, Pennsylvania Population & Nativity History
| Year | Total Pop | Foreign Born | Native Born |
|---|---|---|---|
| 2024 | 25,967 | 1.7% | 98.3% |
| 2023 | 26,075 | 1.5% | 98.5% |
| 2022 | 26,219 | 1.5% | 98.5% |
| 2021 | 26,389 | 1.4% | 98.6% |
| 2020 | 27,078 | 1.3% | 98.7% |
| 2019 | 27,327 | 1.1% | 98.9% |
| 2018 | 27,588 | 1.2% | 98.8% |
| 2017 | 27,760 | 1.2% | 98.8% |
| 2016 | 27,975 | 1.3% | 98.7% |
| 2015 | 28,147 | 1.5% | 98.5% |
| 2014 | 28,229 | 1.6% | 98.4% |
| 2013 | 28,177 | 1.3% | 98.7% |
| 2012 | 28,221 | 1.3% | 98.7% |
| 2011 | 28,333 | 1.3% | 98.7% |
| 2010 | 28,262 | 1.3% | 98.7% |
Nativity & Citizenship FAQs for Wyoming County, Pennsylvania
Approximately 1.7% of residents in Wyoming County, Pennsylvania were born outside the United States.
The vast majority of residents, roughly 99.1%, are U.S. citizens (including both native-born and naturalized citizens).