Westmoreland County, Pennsylvania Nativity & Citizenship Status (2024)
Place of birth and citizenship status analysis for Westmoreland County, Pennsylvania
Westmoreland County, Pennsylvania Nativity & Citizenship Indicators (2024)
Native Born
98.1%
Foreign Born
1.9%
Naturalized
1.3%
US Citizens
99.4%
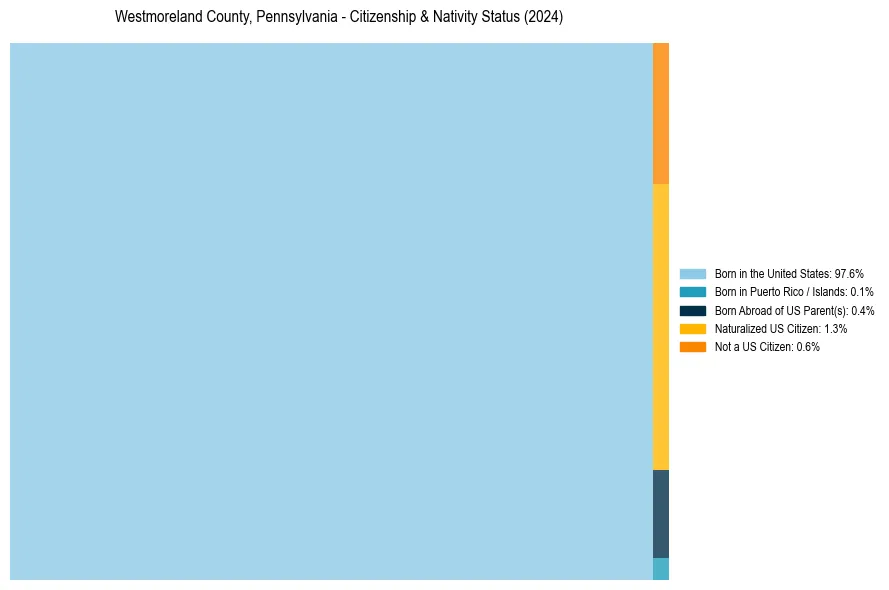
Westmoreland County, Pennsylvania Nativity & Citizenship Distribution
Westmoreland County, Pennsylvania Historical Nativity Trends (2010–2024)
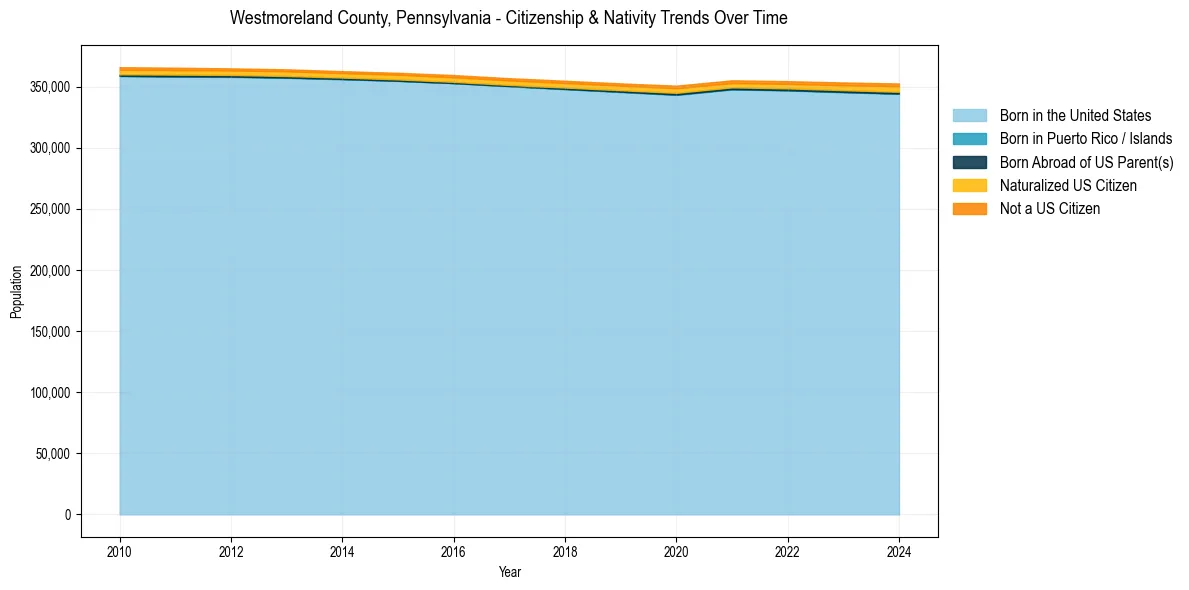
Westmoreland County, Pennsylvania Population & Nativity History
| Year | Total Pop | Foreign Born | Native Born |
|---|---|---|---|
| 2024 | 352,500 | 1.9% | 98.1% |
| 2023 | 353,345 | 1.8% | 98.2% |
| 2022 | 354,414 | 1.7% | 98.3% |
| 2021 | 355,107 | 1.6% | 98.4% |
| 2020 | 350,722 | 1.7% | 98.3% |
| 2019 | 352,590 | 1.6% | 98.4% |
| 2018 | 354,751 | 1.6% | 98.4% |
| 2017 | 356,835 | 1.5% | 98.5% |
| 2016 | 359,377 | 1.5% | 98.5% |
| 2015 | 361,251 | 1.5% | 98.5% |
| 2014 | 362,587 | 1.4% | 98.6% |
| 2013 | 364,090 | 1.5% | 98.5% |
| 2012 | 364,877 | 1.5% | 98.5% |
| 2011 | 365,438 | 1.6% | 98.4% |
| 2010 | 365,841 | 1.6% | 98.4% |
Nativity & Citizenship FAQs for Westmoreland County, Pennsylvania
Approximately 1.9% of residents in Westmoreland County, Pennsylvania were born outside the United States.
The vast majority of residents, roughly 99.4%, are U.S. citizens (including both native-born and naturalized citizens).