Washington County, Pennsylvania Nativity & Citizenship Status (2024)
Place of birth and citizenship status analysis for Washington County, Pennsylvania
Washington County, Pennsylvania Nativity & Citizenship Indicators (2024)
Native Born
97.6%
Foreign Born
2.4%
Naturalized
1.3%
US Citizens
98.9%
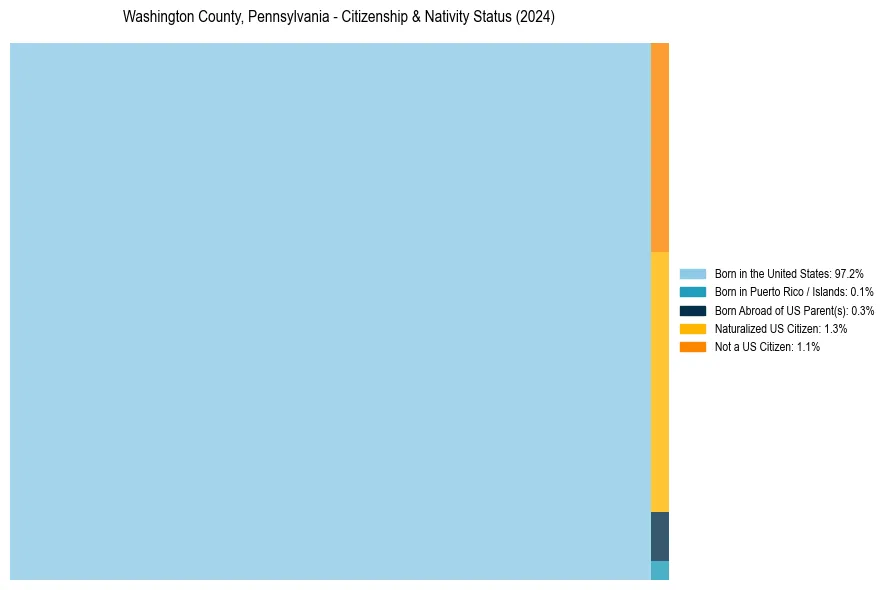
Washington County, Pennsylvania Nativity & Citizenship Distribution
Washington County, Pennsylvania Historical Nativity Trends (2010–2024)
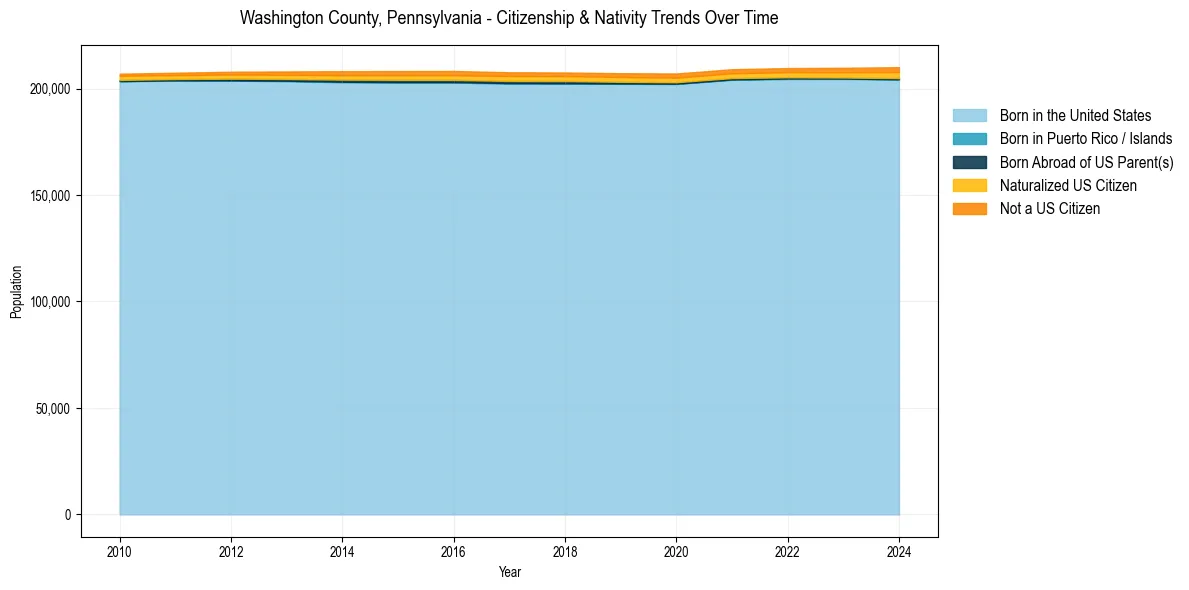
Washington County, Pennsylvania Population & Nativity History
| Year | Total Pop | Foreign Born | Native Born |
|---|---|---|---|
| 2024 | 210,042 | 2.4% | 97.6% |
| 2023 | 209,778 | 2.2% | 97.8% |
| 2022 | 209,631 | 2.1% | 97.9% |
| 2021 | 209,090 | 2.0% | 98.0% |
| 2020 | 207,081 | 2.0% | 98.0% |
| 2019 | 207,212 | 1.9% | 98.1% |
| 2018 | 207,547 | 1.9% | 98.1% |
| 2017 | 207,661 | 2.0% | 98.0% |
| 2016 | 208,269 | 2.0% | 98.0% |
| 2015 | 208,226 | 2.0% | 98.0% |
| 2014 | 208,157 | 1.9% | 98.1% |
| 2013 | 208,047 | 1.7% | 98.3% |
| 2012 | 207,916 | 1.6% | 98.4% |
| 2011 | 207,451 | 1.4% | 98.6% |
| 2010 | 206,987 | 1.4% | 98.6% |
Nativity & Citizenship FAQs for Washington County, Pennsylvania
Approximately 2.4% of residents in Washington County, Pennsylvania were born outside the United States.
The vast majority of residents, roughly 98.9%, are U.S. citizens (including both native-born and naturalized citizens).