Venango County, Pennsylvania Nativity & Citizenship Status (2024)
Place of birth and citizenship status analysis for Venango County, Pennsylvania
Venango County, Pennsylvania Nativity & Citizenship Indicators (2024)
Native Born
99.2%
Foreign Born
0.8%
Naturalized
0.5%
US Citizens
99.6%
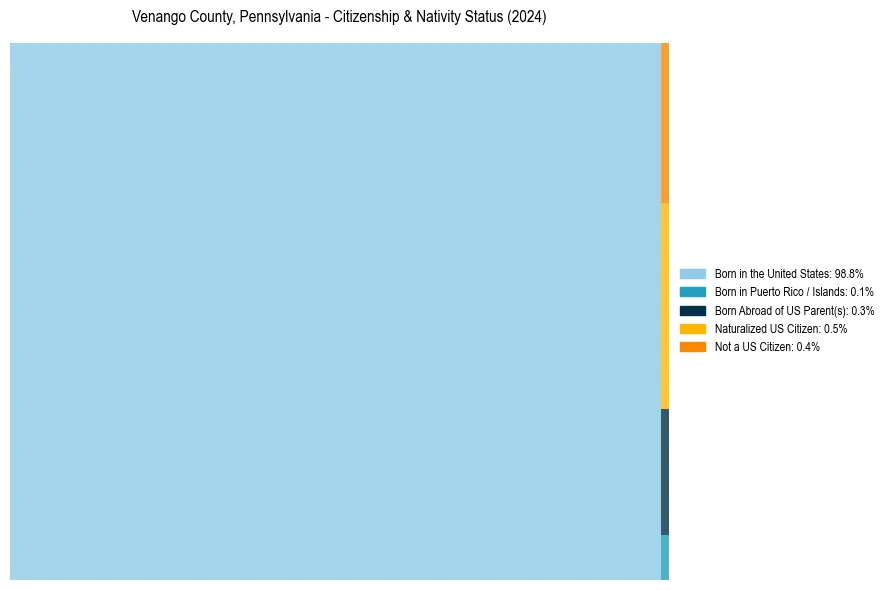
Venango County, Pennsylvania Nativity & Citizenship Distribution
Venango County, Pennsylvania Historical Nativity Trends (2010–2024)
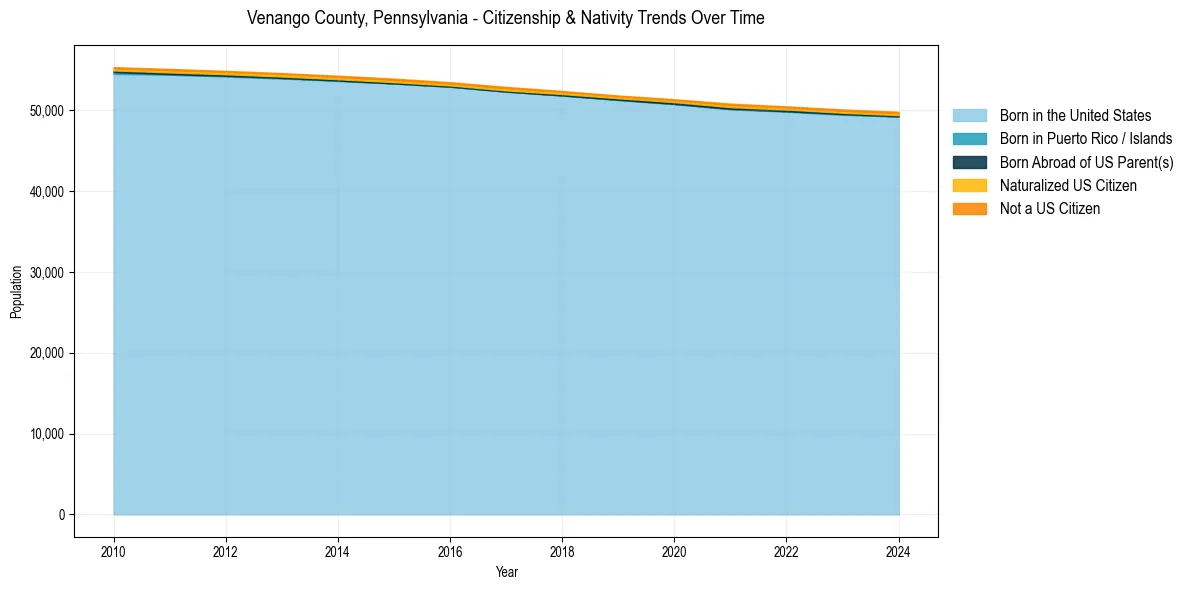
Venango County, Pennsylvania Population & Nativity History
| Year | Total Pop | Foreign Born | Native Born |
|---|---|---|---|
| 2024 | 49,801 | 0.8% | 99.2% |
| 2023 | 50,096 | 0.8% | 99.2% |
| 2022 | 50,475 | 0.8% | 99.2% |
| 2021 | 50,810 | 0.8% | 99.2% |
| 2020 | 51,355 | 0.7% | 99.3% |
| 2019 | 51,818 | 0.7% | 99.3% |
| 2018 | 52,376 | 0.7% | 99.3% |
| 2017 | 52,880 | 0.8% | 99.2% |
| 2016 | 53,460 | 0.7% | 99.3% |
| 2015 | 53,906 | 0.8% | 99.2% |
| 2014 | 54,265 | 0.8% | 99.2% |
| 2013 | 54,590 | 0.8% | 99.2% |
| 2012 | 54,865 | 0.8% | 99.2% |
| 2011 | 55,106 | 0.8% | 99.2% |
| 2010 | 55,320 | 0.7% | 99.3% |
Nativity & Citizenship FAQs for Venango County, Pennsylvania
Approximately 0.8% of residents in Venango County, Pennsylvania were born outside the United States.
The vast majority of residents, roughly 99.6%, are U.S. citizens (including both native-born and naturalized citizens).