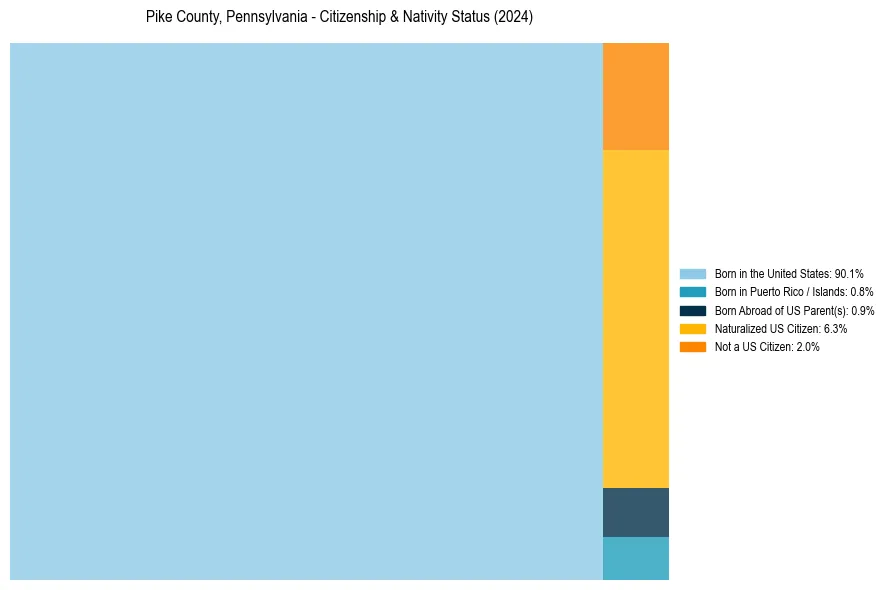
Pike County, Pennsylvania Nativity & Citizenship Status (2024)
Place of birth and citizenship status analysis for Pike County, Pennsylvania
Pike County, Pennsylvania Nativity & Citizenship Indicators (2024)
Native Born
91.8%
Foreign Born
8.2%
Naturalized
6.3%
US Citizens
98.0%
Pike County, Pennsylvania Nativity & Citizenship Distribution
Pike County, Pennsylvania Historical Nativity Trends (2010–2024)
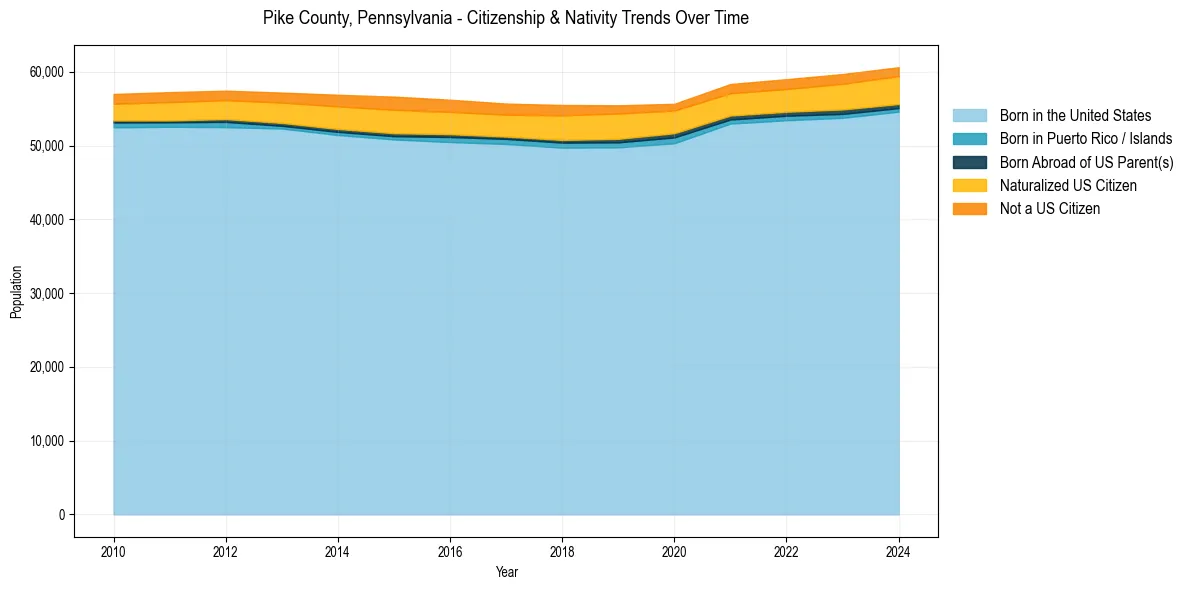
Pike County, Pennsylvania Population & Nativity History
| Year | Total Pop | Foreign Born | Native Born |
|---|---|---|---|
| 2024 | 60,621 | 8.2% | 91.8% |
| 2023 | 59,691 | 8.0% | 92.0% |
| 2022 | 58,996 | 7.5% | 92.5% |
| 2021 | 58,345 | 7.3% | 92.7% |
| 2020 | 55,660 | 7.2% | 92.8% |
| 2019 | 55,453 | 8.2% | 91.8% |
| 2018 | 55,498 | 8.5% | 91.5% |
| 2017 | 55,687 | 8.0% | 92.0% |
| 2016 | 56,210 | 8.3% | 91.7% |
| 2015 | 56,632 | 8.8% | 91.2% |
| 2014 | 56,883 | 8.2% | 91.8% |
| 2013 | 57,179 | 7.2% | 92.8% |
| 2012 | 57,437 | 6.7% | 93.3% |
| 2011 | 57,242 | 6.7% | 93.3% |
| 2010 | 56,993 | 6.3% | 93.7% |
Nativity & Citizenship FAQs for Pike County, Pennsylvania
Approximately 8.2% of residents in Pike County, Pennsylvania were born outside the United States.
The vast majority of residents, roughly 98.0%, are U.S. citizens (including both native-born and naturalized citizens).