Philadelphia County, Pennsylvania Nativity & Citizenship Status (2024)
Place of birth and citizenship status analysis for Philadelphia County, Pennsylvania
Philadelphia County, Pennsylvania Nativity & Citizenship Indicators (2024)
Native Born
84.8%
Foreign Born
15.2%
Naturalized
7.8%
US Citizens
92.7%
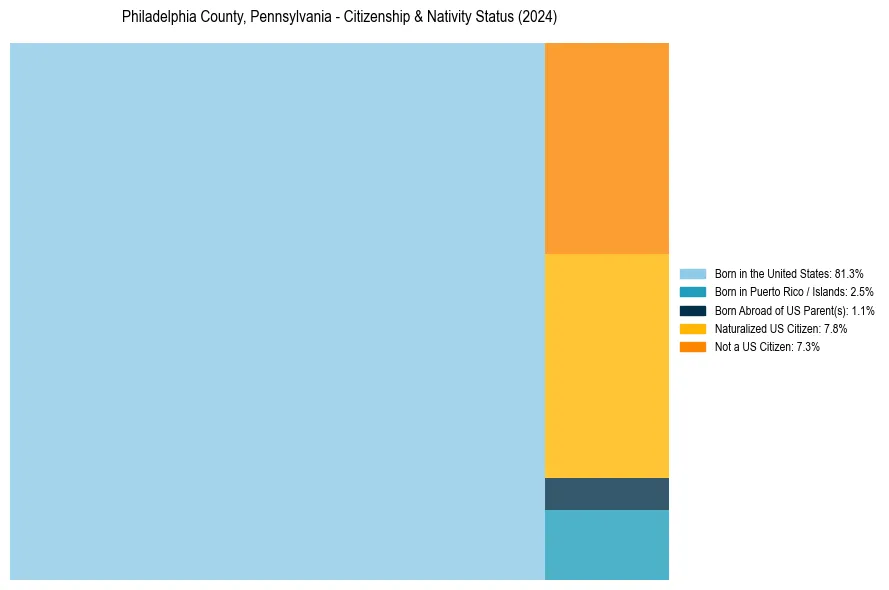
Philadelphia County, Pennsylvania Nativity & Citizenship Distribution
Philadelphia County, Pennsylvania Historical Nativity Trends (2010–2024)
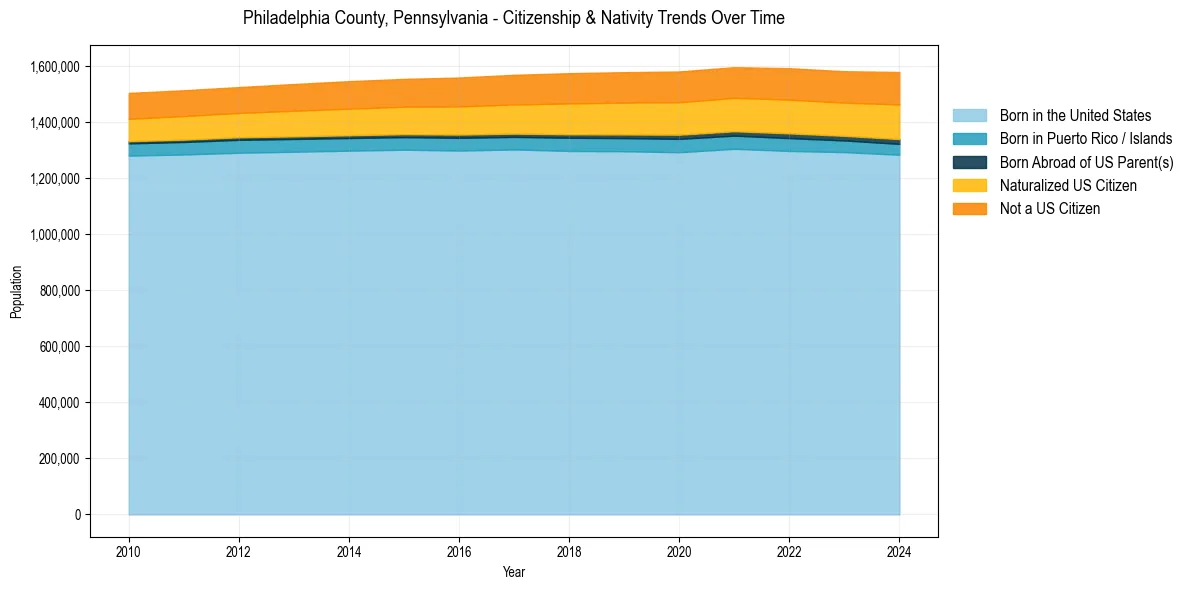
Philadelphia County, Pennsylvania Population & Nativity History
| Year | Total Pop | Foreign Born | Native Born |
|---|---|---|---|
| 2024 | 1,579,706 | 15.2% | 84.8% |
| 2023 | 1,582,432 | 14.6% | 85.4% |
| 2022 | 1,593,208 | 14.6% | 85.4% |
| 2021 | 1,596,865 | 14.3% | 85.7% |
| 2020 | 1,581,531 | 14.3% | 85.7% |
| 2019 | 1,579,075 | 14.1% | 85.9% |
| 2018 | 1,575,522 | 13.9% | 86.1% |
| 2017 | 1,569,657 | 13.4% | 86.6% |
| 2016 | 1,559,938 | 13.1% | 86.9% |
| 2015 | 1,555,072 | 12.7% | 87.3% |
| 2014 | 1,546,920 | 12.5% | 87.5% |
| 2013 | 1,536,704 | 12.2% | 87.8% |
| 2012 | 1,525,811 | 11.8% | 88.2% |
| 2011 | 1,514,456 | 11.6% | 88.4% |
| 2010 | 1,504,950 | 11.5% | 88.5% |
Nativity & Citizenship FAQs for Philadelphia County, Pennsylvania
Approximately 15.2% of residents in Philadelphia County, Pennsylvania were born outside the United States.
The vast majority of residents, roughly 92.7%, are U.S. citizens (including both native-born and naturalized citizens).