Philadelphia County, Pennsylvania Health Insurance Coverage (2024)
Detailed analysis of uninsured rates and coverage trends for Philadelphia County, Pennsylvania
Universe
1,567,591
Total Uninsured
111,385
Uninsured Rate
7.1%
Coverage by Age and Gender
Distribution of insured vs. uninsured residents in Philadelphia County, Pennsylvania
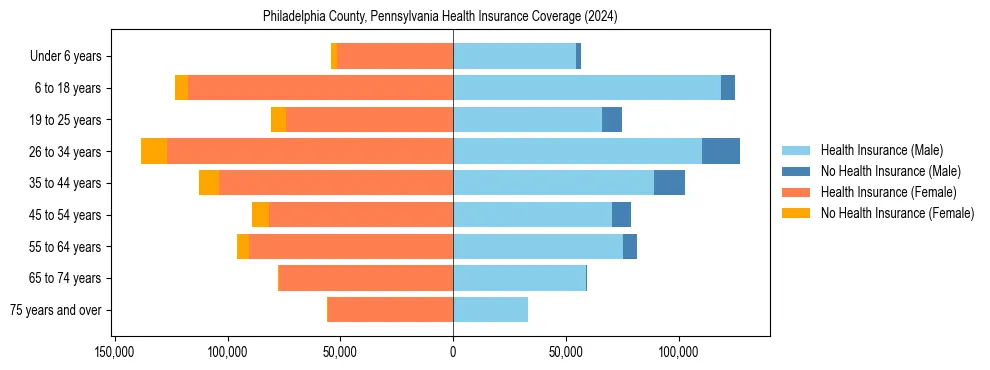
Uninsured Rates by Demographic Group
Under 18 Years
Male Uninsured4.5%
Female Uninsured4.7%
18 to 34 Years
Male Uninsured12.6%
Female Uninsured8.3%
35 to 64 Years
Male Uninsured10.7%
Female Uninsured7.1%
65 Years & Over
Male Uninsured0.8%
Female Uninsured0.8%
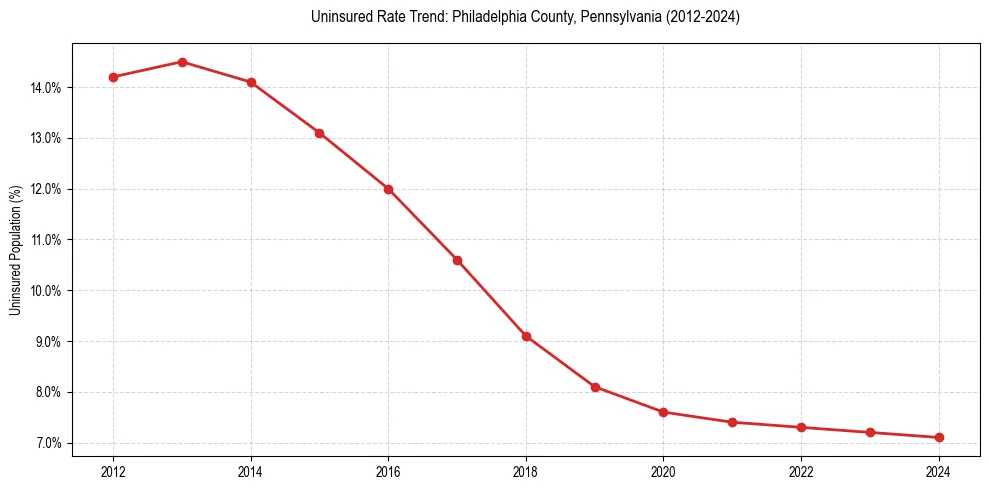
Uninsured Rate Trends
Historical coverage data from 2012 to 2024
| Year | Total Uninsured | Uninsured Rate |
|---|---|---|
| 2024 | 111,385 | 7.1% |
| 2023 | 112,579 | 7.2% |
| 2022 | 116,128 | 7.3% |
| 2021 | 117,045 | 7.4% |
| 2020 | 119,436 | 7.6% |
| 2019 | 127,508 | 8.1% |
| 2018 | 142,238 | 9.1% |
| 2017 | 164,833 | 10.6% |
| 2016 | 184,975 | 12.0% |
| 2015 | 201,587 | 13.1% |
| 2014 | 216,348 | 14.1% |
| 2013 | 220,126 | 14.5% |
| 2012 | 214,493 | 14.2% |
Frequently Asked Questions
Approximately 7.1% of the population in Philadelphia County, Pennsylvania does not have health insurance coverage.
In Philadelphia County, Pennsylvania, young adult males (18-34) face the highest barrier to coverage, with an uninsured rate of 12.6%. This is notably higher than the overall local average of 7.1%.