Pennsylvania Nativity & Citizenship Status (2024)
Place of birth and citizenship status analysis for Pennsylvania
Pennsylvania Nativity & Citizenship Indicators (2024)
Native Born
92.3%
Foreign Born
7.7%
Naturalized
4.3%
US Citizens
96.6%
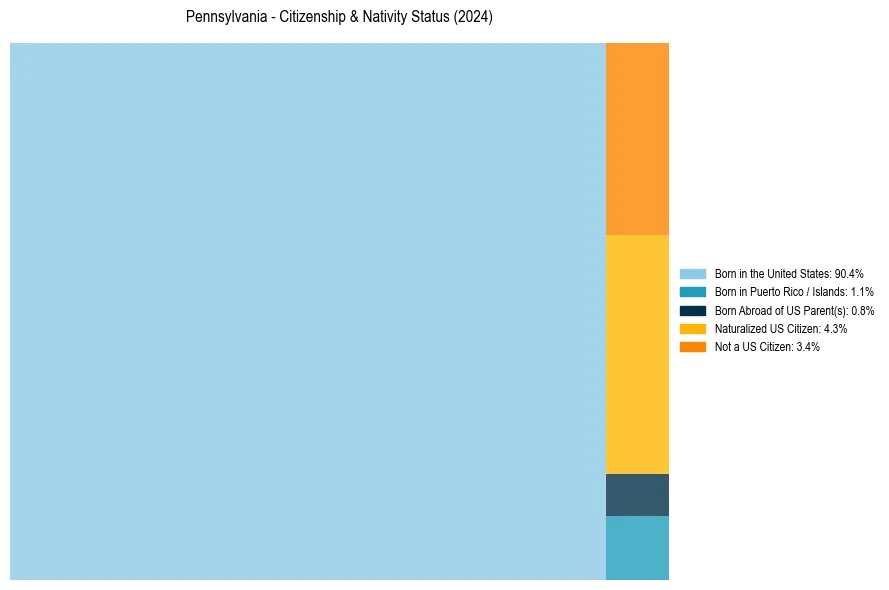
Pennsylvania Nativity & Citizenship Distribution
Pennsylvania Historical Nativity Trends (2010–2024)
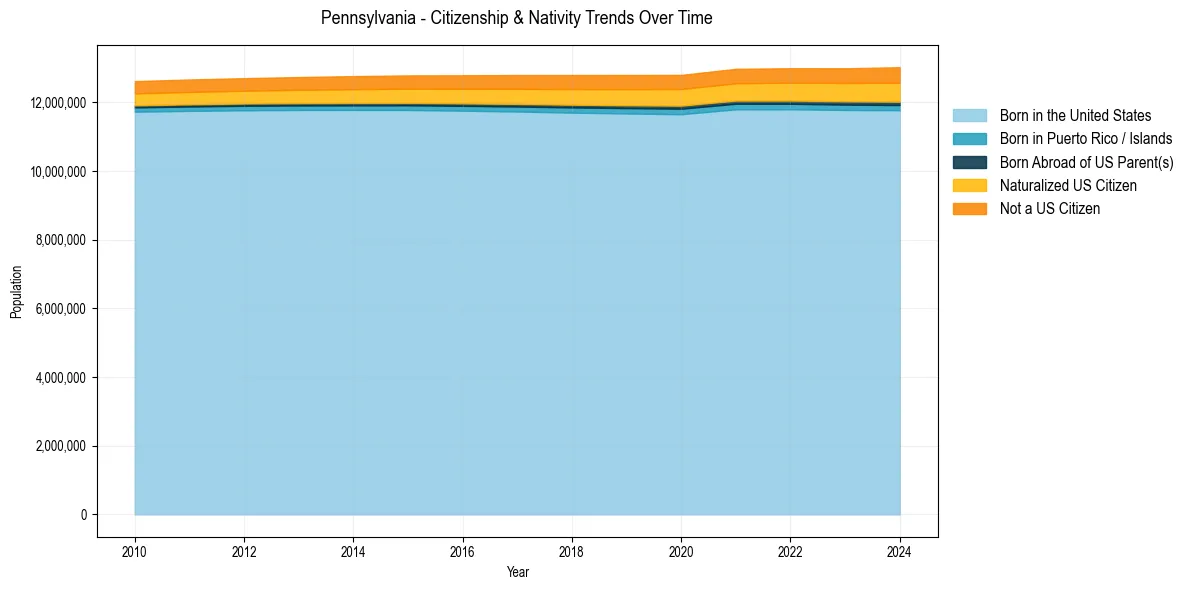
Pennsylvania Population & Nativity History
| Year | Total Pop | Foreign Born | Native Born |
|---|---|---|---|
| 2024 | 13,018,639 | 7.7% | 92.3% |
| 2023 | 12,986,518 | 7.4% | 92.6% |
| 2022 | 12,989,208 | 7.3% | 92.7% |
| 2021 | 12,970,650 | 7.1% | 92.9% |
| 2020 | 12,794,885 | 7.0% | 93.0% |
| 2019 | 12,791,530 | 6.9% | 93.1% |
| 2018 | 12,791,181 | 6.8% | 93.2% |
| 2017 | 12,790,505 | 6.6% | 93.4% |
| 2016 | 12,783,977 | 6.4% | 93.6% |
| 2015 | 12,779,559 | 6.3% | 93.7% |
| 2014 | 12,758,729 | 6.1% | 93.9% |
| 2013 | 12,731,381 | 6.0% | 94.0% |
| 2012 | 12,699,589 | 5.8% | 94.2% |
| 2011 | 12,660,739 | 5.7% | 94.3% |
| 2010 | 12,612,705 | 5.6% | 94.4% |
Nativity & Citizenship FAQs for Pennsylvania
Approximately 7.7% of residents in Pennsylvania were born outside the United States.
The vast majority of residents, roughly 96.6%, are U.S. citizens (including both native-born and naturalized citizens).