Montgomery County, Pennsylvania Nativity & Citizenship Status (2024)
Place of birth and citizenship status analysis for Montgomery County, Pennsylvania
Montgomery County, Pennsylvania Nativity & Citizenship Indicators (2024)
Native Born
88.5%
Foreign Born
11.5%
Naturalized
6.9%
US Citizens
95.4%
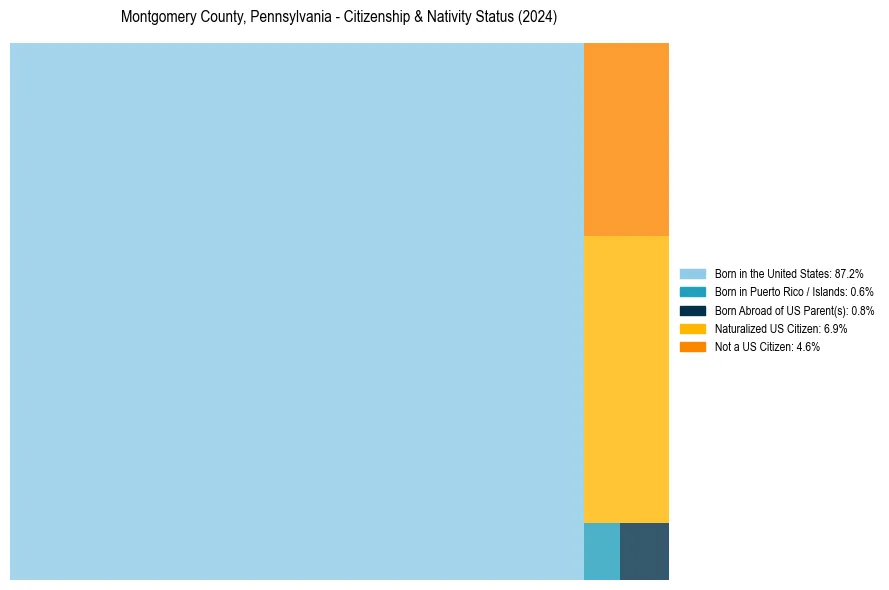
Montgomery County, Pennsylvania Nativity & Citizenship Distribution
Montgomery County, Pennsylvania Historical Nativity Trends (2010–2024)
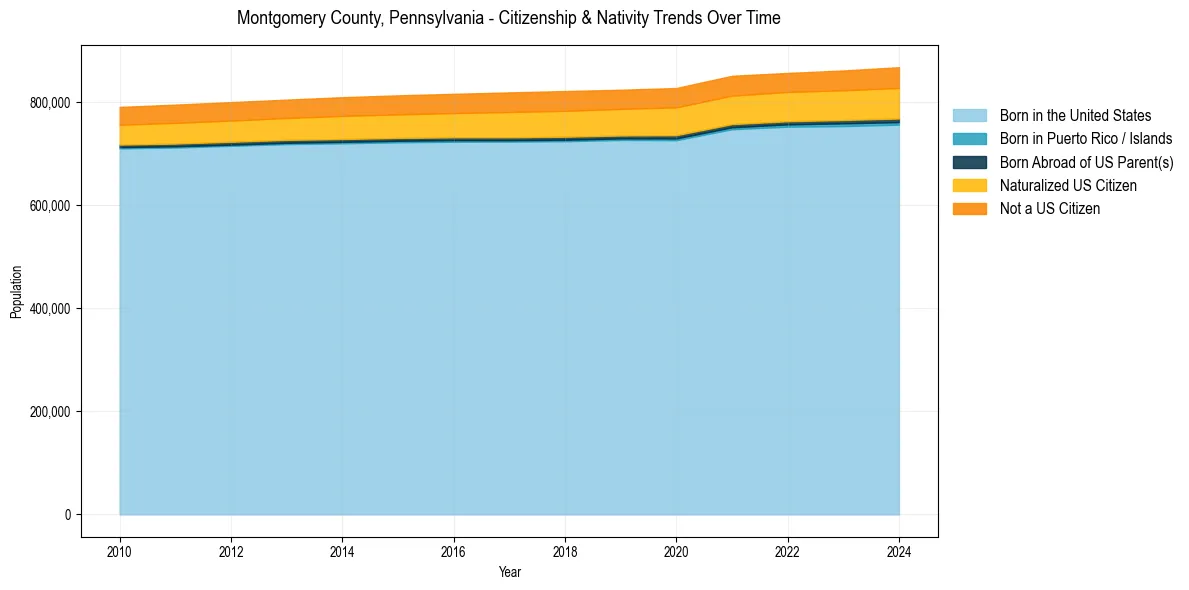
Montgomery County, Pennsylvania Population & Nativity History
| Year | Total Pop | Foreign Born | Native Born |
|---|---|---|---|
| 2024 | 867,573 | 11.5% | 88.5% |
| 2023 | 861,225 | 11.2% | 88.8% |
| 2022 | 856,399 | 10.9% | 89.1% |
| 2021 | 850,890 | 11.0% | 89.0% |
| 2020 | 827,180 | 11.1% | 88.9% |
| 2019 | 823,823 | 10.8% | 89.2% |
| 2018 | 821,301 | 10.8% | 89.2% |
| 2017 | 818,677 | 10.7% | 89.3% |
| 2016 | 815,876 | 10.3% | 89.7% |
| 2015 | 812,970 | 10.2% | 89.8% |
| 2014 | 809,372 | 10.0% | 90.0% |
| 2013 | 804,621 | 9.7% | 90.3% |
| 2012 | 799,886 | 9.6% | 90.4% |
| 2011 | 794,921 | 9.5% | 90.5% |
| 2010 | 790,497 | 9.3% | 90.7% |
Nativity & Citizenship FAQs for Montgomery County, Pennsylvania
Approximately 11.5% of residents in Montgomery County, Pennsylvania were born outside the United States.
The vast majority of residents, roughly 95.4%, are U.S. citizens (including both native-born and naturalized citizens).