Mercer County, Pennsylvania Nativity & Citizenship Status (2024)
Place of birth and citizenship status analysis for Mercer County, Pennsylvania
Mercer County, Pennsylvania Nativity & Citizenship Indicators (2024)
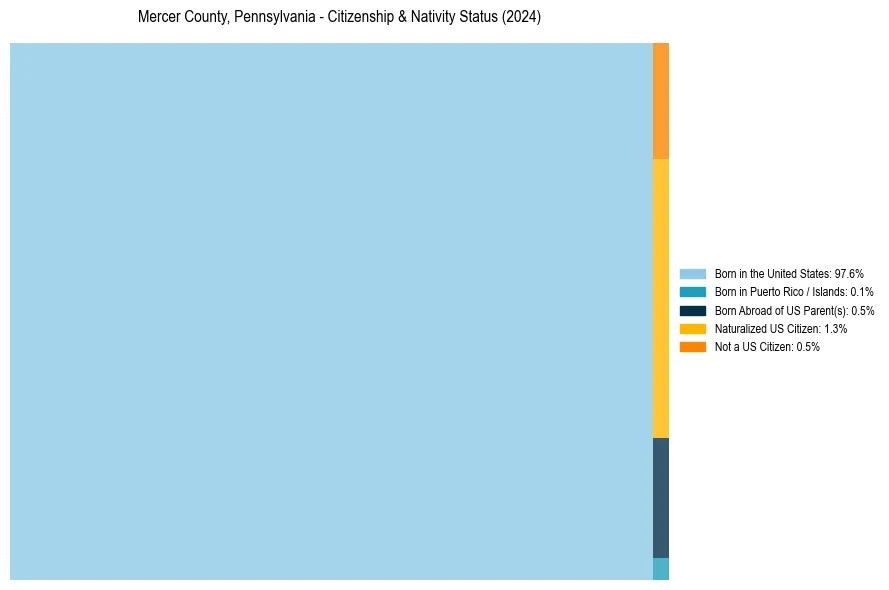
Native Born
98.2%
Foreign Born
1.8%
Naturalized
1.3%
US Citizens
99.5%
Mercer County, Pennsylvania Nativity & Citizenship Distribution
Mercer County, Pennsylvania Historical Nativity Trends (2010–2024)
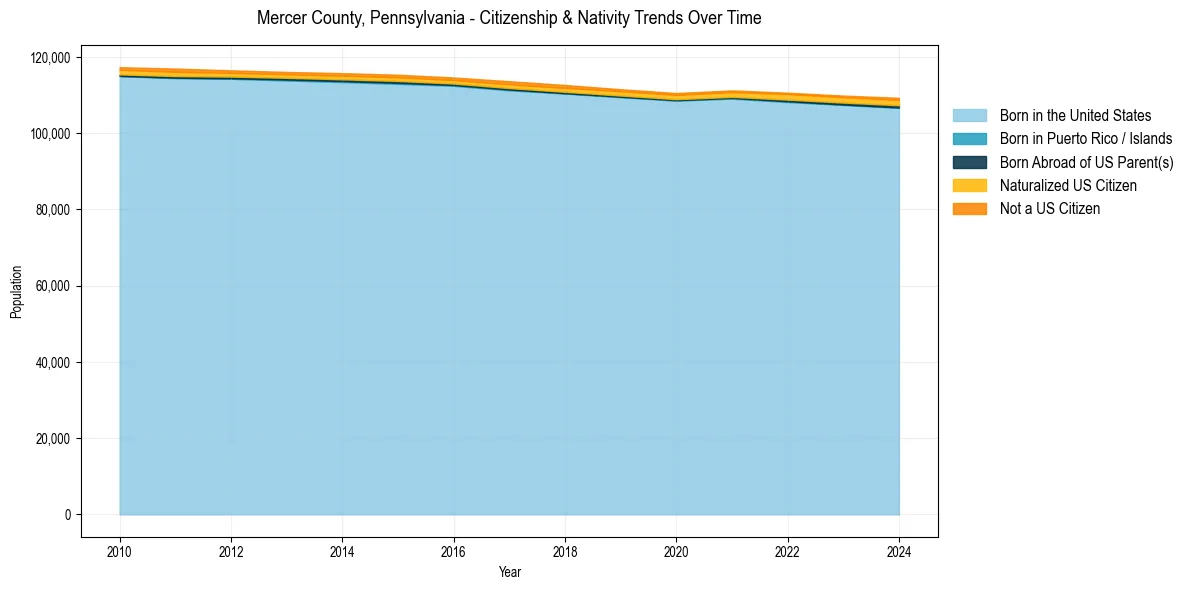
Mercer County, Pennsylvania Population & Nativity History
| Year | Total Pop | Foreign Born | Native Born |
|---|---|---|---|
| 2024 | 109,257 | 1.8% | 98.2% |
| 2023 | 109,852 | 1.7% | 98.3% |
| 2022 | 110,600 | 1.6% | 98.4% |
| 2021 | 111,216 | 1.5% | 98.5% |
| 2020 | 110,519 | 1.5% | 98.5% |
| 2019 | 111,518 | 1.5% | 98.5% |
| 2018 | 112,630 | 1.6% | 98.4% |
| 2017 | 113,623 | 1.6% | 98.4% |
| 2016 | 114,598 | 1.4% | 98.6% |
| 2015 | 115,320 | 1.4% | 98.6% |
| 2014 | 115,739 | 1.4% | 98.6% |
| 2013 | 116,059 | 1.3% | 98.7% |
| 2012 | 116,474 | 1.4% | 98.6% |
| 2011 | 116,939 | 1.7% | 98.3% |
| 2010 | 117,296 | 1.6% | 98.4% |
Nativity & Citizenship FAQs for Mercer County, Pennsylvania
Approximately 1.8% of residents in Mercer County, Pennsylvania were born outside the United States.
The vast majority of residents, roughly 99.5%, are U.S. citizens (including both native-born and naturalized citizens).