Luzerne County, Pennsylvania Nativity & Citizenship Status (2024)
Place of birth and citizenship status analysis for Luzerne County, Pennsylvania
Luzerne County, Pennsylvania Nativity & Citizenship Indicators (2024)
Native Born
90.4%
Foreign Born
9.6%
Naturalized
4.4%
US Citizens
94.8%
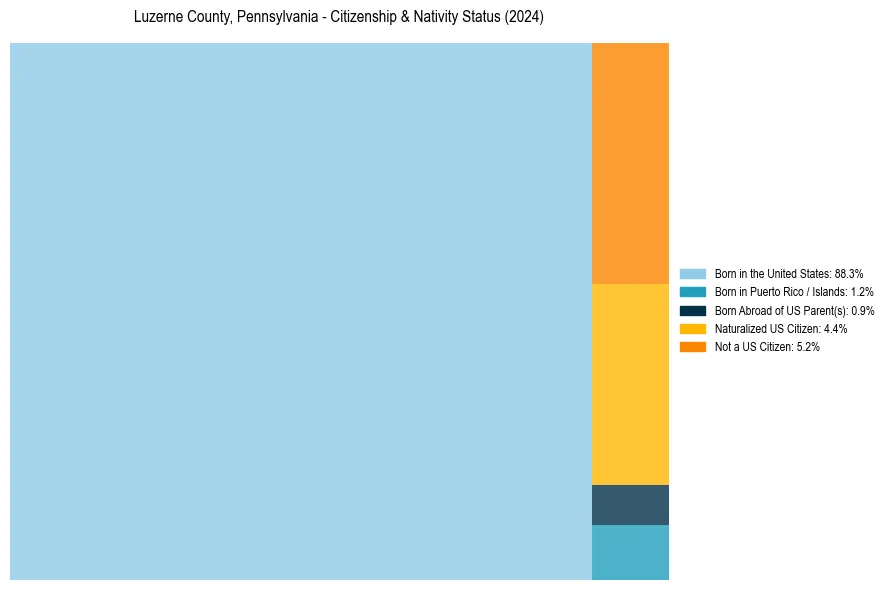
Luzerne County, Pennsylvania Nativity & Citizenship Distribution
Luzerne County, Pennsylvania Historical Nativity Trends (2010–2024)
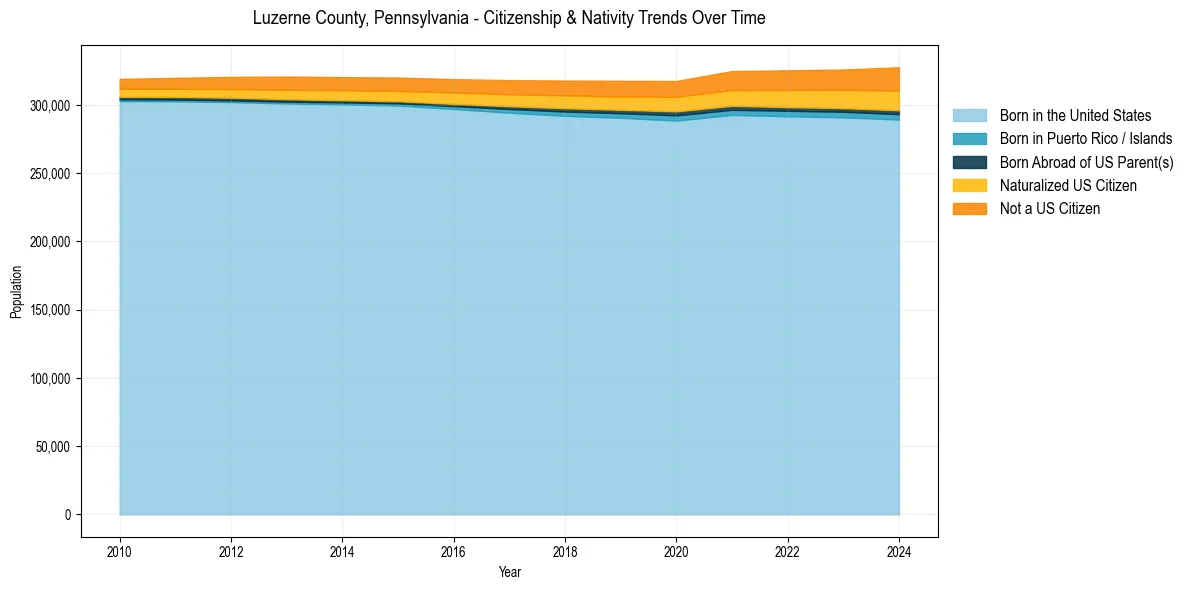
Luzerne County, Pennsylvania Population & Nativity History
| Year | Total Pop | Foreign Born | Native Born |
|---|---|---|---|
| 2024 | 327,675 | 9.6% | 90.4% |
| 2023 | 325,978 | 8.7% | 91.3% |
| 2022 | 325,396 | 8.3% | 91.7% |
| 2021 | 324,825 | 7.8% | 92.2% |
| 2020 | 317,547 | 7.0% | 93.0% |
| 2019 | 317,663 | 6.7% | 93.3% |
| 2018 | 317,884 | 6.4% | 93.6% |
| 2017 | 318,222 | 6.0% | 94.0% |
| 2016 | 318,917 | 5.7% | 94.3% |
| 2015 | 320,095 | 5.4% | 94.6% |
| 2014 | 320,392 | 5.3% | 94.7% |
| 2013 | 320,827 | 5.2% | 94.8% |
| 2012 | 320,555 | 4.8% | 95.2% |
| 2011 | 319,897 | 4.4% | 95.6% |
| 2010 | 319,120 | 4.1% | 95.9% |
Nativity & Citizenship FAQs for Luzerne County, Pennsylvania
Approximately 9.6% of residents in Luzerne County, Pennsylvania were born outside the United States.
The vast majority of residents, roughly 94.8%, are U.S. citizens (including both native-born and naturalized citizens).