Lehigh County, Pennsylvania Nativity & Citizenship Status (2024)
Place of birth and citizenship status analysis for Lehigh County, Pennsylvania
Lehigh County, Pennsylvania Nativity & Citizenship Indicators (2024)
Native Born
85.6%
Foreign Born
14.4%
Naturalized
7.7%
US Citizens
93.3%
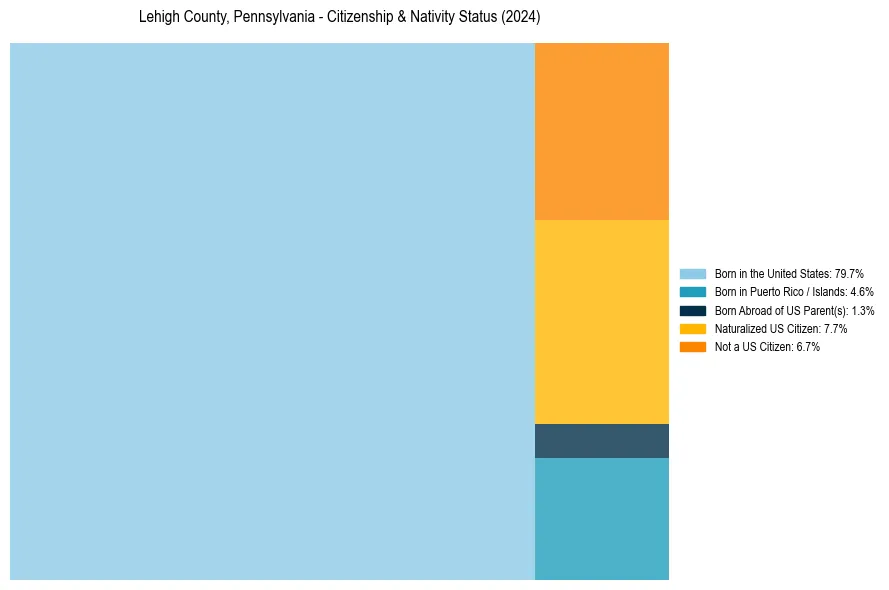
Lehigh County, Pennsylvania Nativity & Citizenship Distribution
Lehigh County, Pennsylvania Historical Nativity Trends (2010–2024)
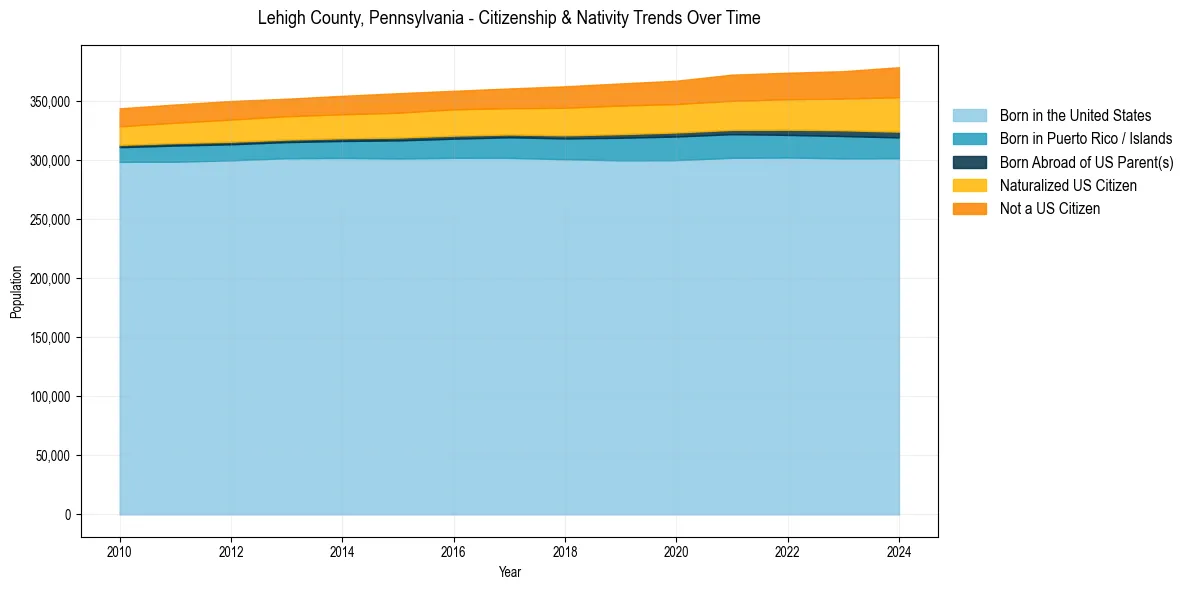
Lehigh County, Pennsylvania Population & Nativity History
| Year | Total Pop | Foreign Born | Native Born |
|---|---|---|---|
| 2024 | 378,792 | 14.4% | 85.6% |
| 2023 | 375,408 | 13.3% | 86.7% |
| 2022 | 374,110 | 12.9% | 87.1% |
| 2021 | 372,492 | 12.6% | 87.4% |
| 2020 | 367,338 | 11.9% | 88.1% |
| 2019 | 365,052 | 11.8% | 88.2% |
| 2018 | 362,613 | 11.5% | 88.5% |
| 2017 | 360,774 | 10.8% | 89.2% |
| 2016 | 358,792 | 10.6% | 89.4% |
| 2015 | 356,756 | 10.5% | 89.5% |
| 2014 | 354,537 | 10.1% | 89.9% |
| 2013 | 352,068 | 9.8% | 90.2% |
| 2012 | 350,165 | 9.9% | 90.1% |
| 2011 | 347,197 | 9.4% | 90.6% |
| 2010 | 343,946 | 9.0% | 91.0% |
Nativity & Citizenship FAQs for Lehigh County, Pennsylvania
Approximately 14.4% of residents in Lehigh County, Pennsylvania were born outside the United States.
The vast majority of residents, roughly 93.3%, are U.S. citizens (including both native-born and naturalized citizens).