Lebanon County, Pennsylvania Nativity & Citizenship Status (2024)
Place of birth and citizenship status analysis for Lebanon County, Pennsylvania
Lebanon County, Pennsylvania Nativity & Citizenship Indicators (2024)
Native Born
95.7%
Foreign Born
4.3%
Naturalized
2.8%
US Citizens
98.4%
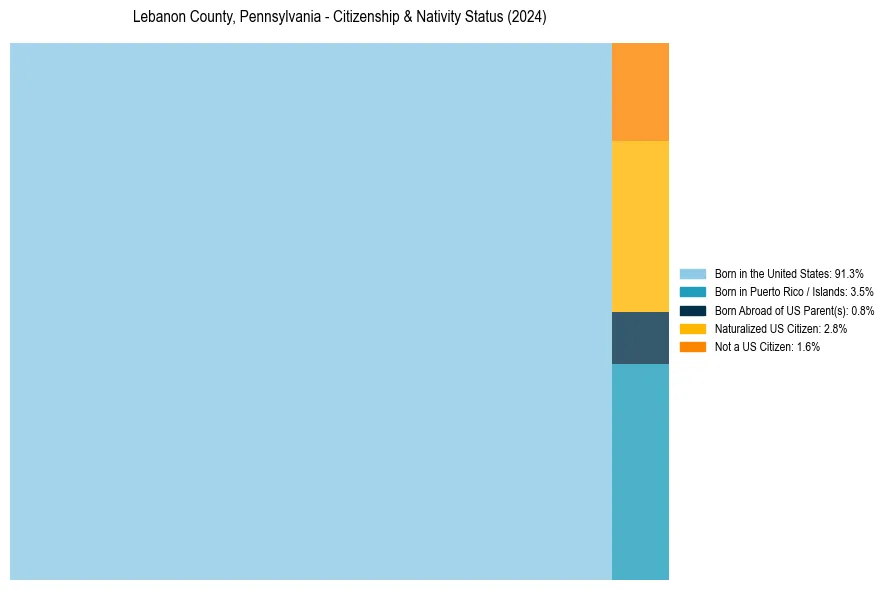
Lebanon County, Pennsylvania Nativity & Citizenship Distribution
Lebanon County, Pennsylvania Historical Nativity Trends (2010–2024)
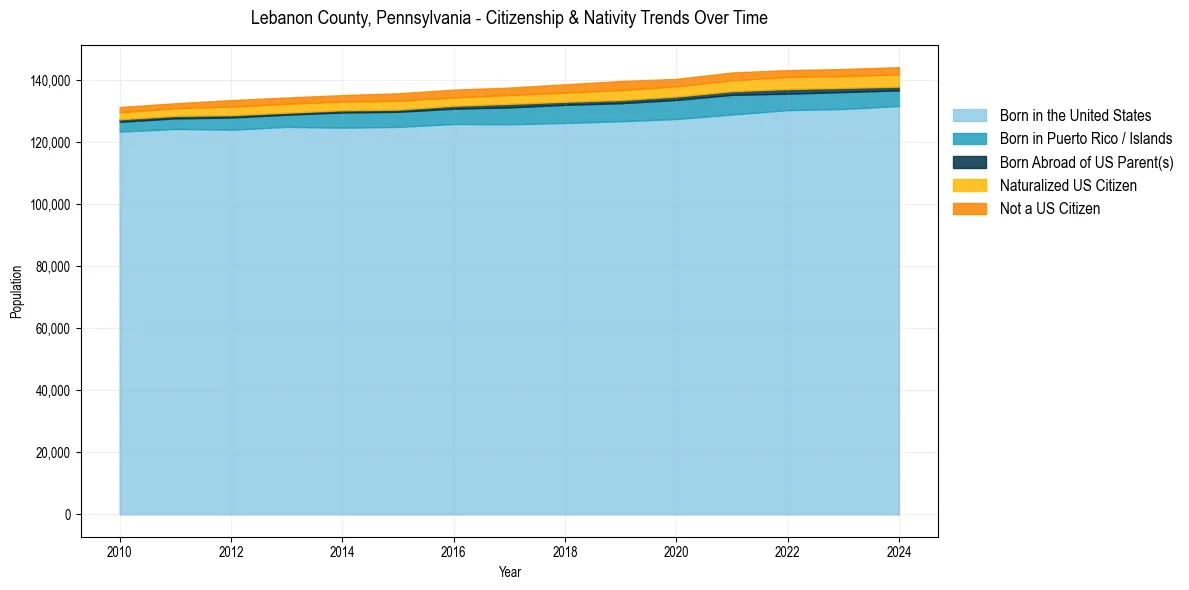
Lebanon County, Pennsylvania Population & Nativity History
| Year | Total Pop | Foreign Born | Native Born |
|---|---|---|---|
| 2024 | 144,186 | 4.3% | 95.7% |
| 2023 | 143,592 | 4.2% | 95.8% |
| 2022 | 143,258 | 4.3% | 95.7% |
| 2021 | 142,486 | 4.2% | 95.8% |
| 2020 | 140,410 | 4.1% | 95.9% |
| 2019 | 139,729 | 4.4% | 95.6% |
| 2018 | 138,674 | 4.1% | 95.9% |
| 2017 | 137,616 | 3.8% | 96.2% |
| 2016 | 136,950 | 3.8% | 96.2% |
| 2015 | 135,776 | 3.9% | 96.1% |
| 2014 | 135,184 | 3.6% | 96.4% |
| 2013 | 134,411 | 3.6% | 96.4% |
| 2012 | 133,578 | 3.6% | 96.4% |
| 2011 | 132,550 | 3.1% | 96.9% |
| 2010 | 131,341 | 3.0% | 97.0% |
Nativity & Citizenship FAQs for Lebanon County, Pennsylvania
Approximately 4.3% of residents in Lebanon County, Pennsylvania were born outside the United States.
The vast majority of residents, roughly 98.4%, are U.S. citizens (including both native-born and naturalized citizens).