Lancaster County, Pennsylvania Nativity & Citizenship Status (2024)
Place of birth and citizenship status analysis for Lancaster County, Pennsylvania
Lancaster County, Pennsylvania Nativity & Citizenship Indicators (2024)
Native Born
94.2%
Foreign Born
5.8%
Naturalized
3.6%
US Citizens
97.8%
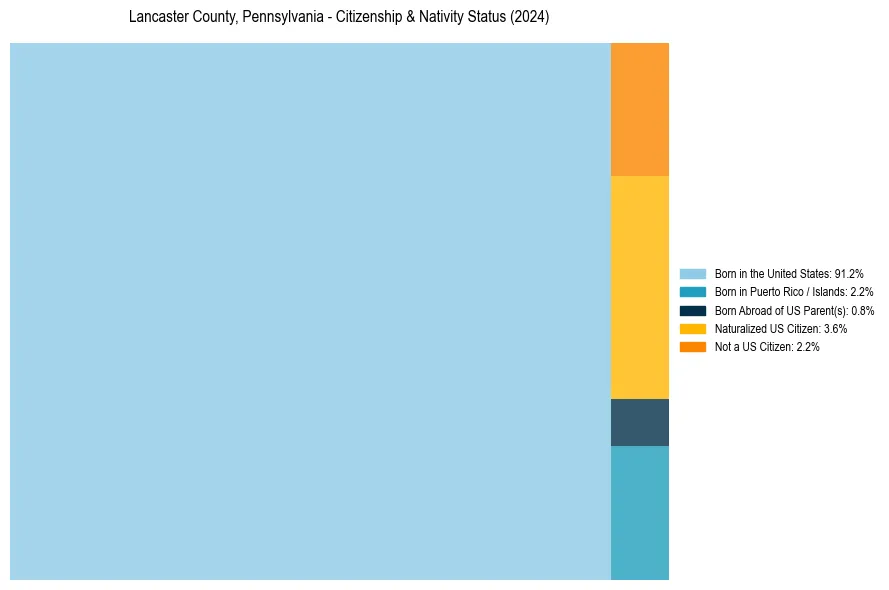
Lancaster County, Pennsylvania Nativity & Citizenship Distribution
Lancaster County, Pennsylvania Historical Nativity Trends (2010–2024)
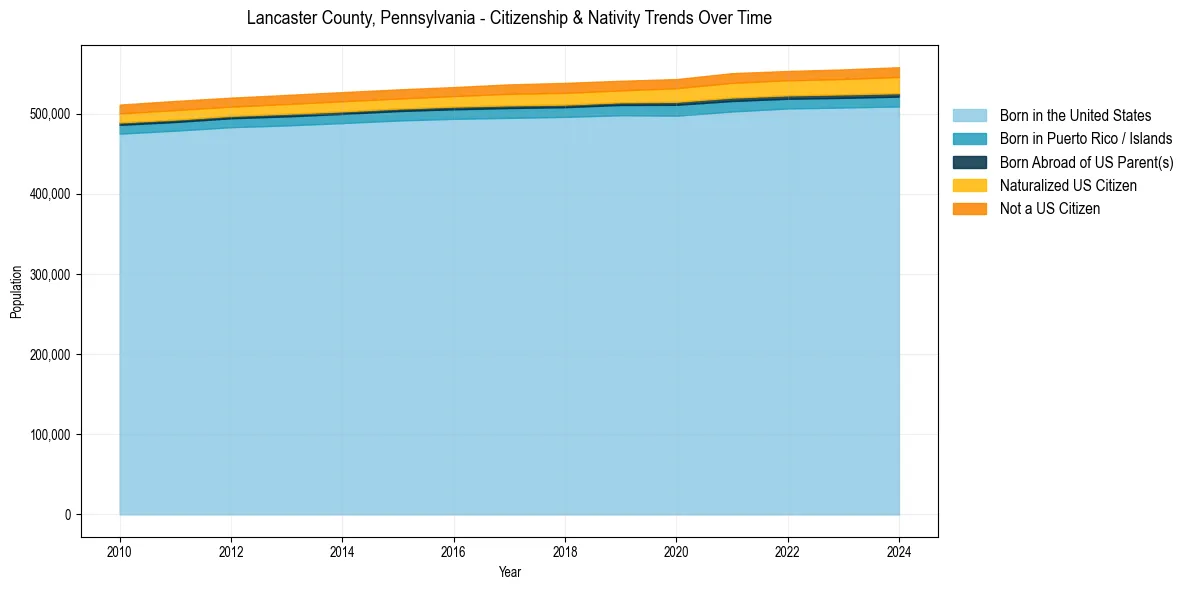
Lancaster County, Pennsylvania Population & Nativity History
| Year | Total Pop | Foreign Born | Native Born |
|---|---|---|---|
| 2024 | 557,931 | 5.8% | 94.2% |
| 2023 | 555,151 | 5.6% | 94.4% |
| 2022 | 553,202 | 5.5% | 94.5% |
| 2021 | 550,480 | 5.5% | 94.5% |
| 2020 | 543,050 | 5.2% | 94.8% |
| 2019 | 540,999 | 5.0% | 95.0% |
| 2018 | 538,347 | 5.0% | 95.0% |
| 2017 | 536,494 | 4.9% | 95.1% |
| 2016 | 533,110 | 4.6% | 95.4% |
| 2015 | 530,216 | 4.5% | 95.5% |
| 2014 | 526,839 | 4.6% | 95.4% |
| 2013 | 523,306 | 4.5% | 95.5% |
| 2012 | 519,913 | 4.4% | 95.6% |
| 2011 | 515,817 | 4.5% | 95.5% |
| 2010 | 511,250 | 4.4% | 95.6% |
Nativity & Citizenship FAQs for Lancaster County, Pennsylvania
Approximately 5.8% of residents in Lancaster County, Pennsylvania were born outside the United States.
The vast majority of residents, roughly 97.8%, are U.S. citizens (including both native-born and naturalized citizens).