Fayette County, Pennsylvania Nativity & Citizenship Status (2024)
Place of birth and citizenship status analysis for Fayette County, Pennsylvania
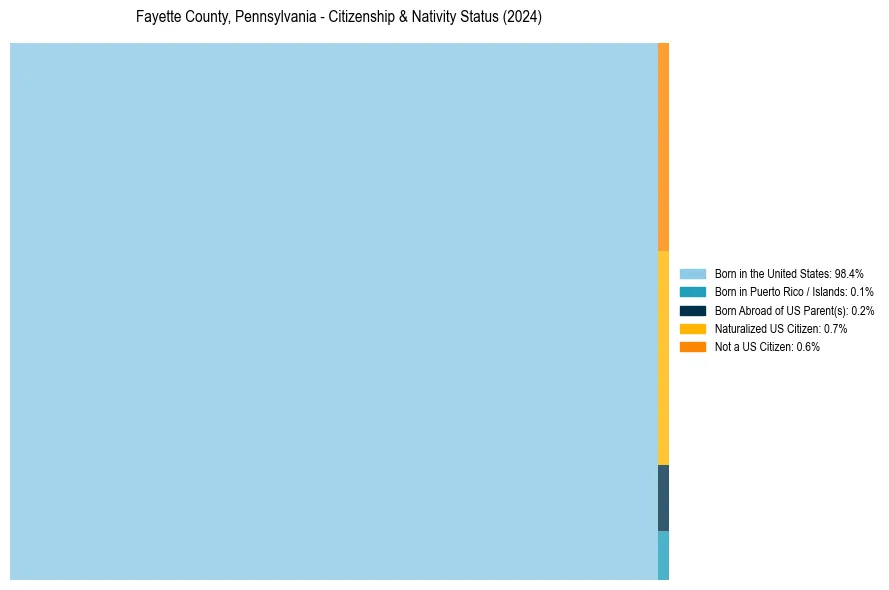
Fayette County, Pennsylvania Nativity & Citizenship Indicators (2024)
Native Born
98.7%
Foreign Born
1.3%
Naturalized
0.7%
US Citizens
99.4%
Fayette County, Pennsylvania Nativity & Citizenship Distribution
Fayette County, Pennsylvania Historical Nativity Trends (2010–2024)
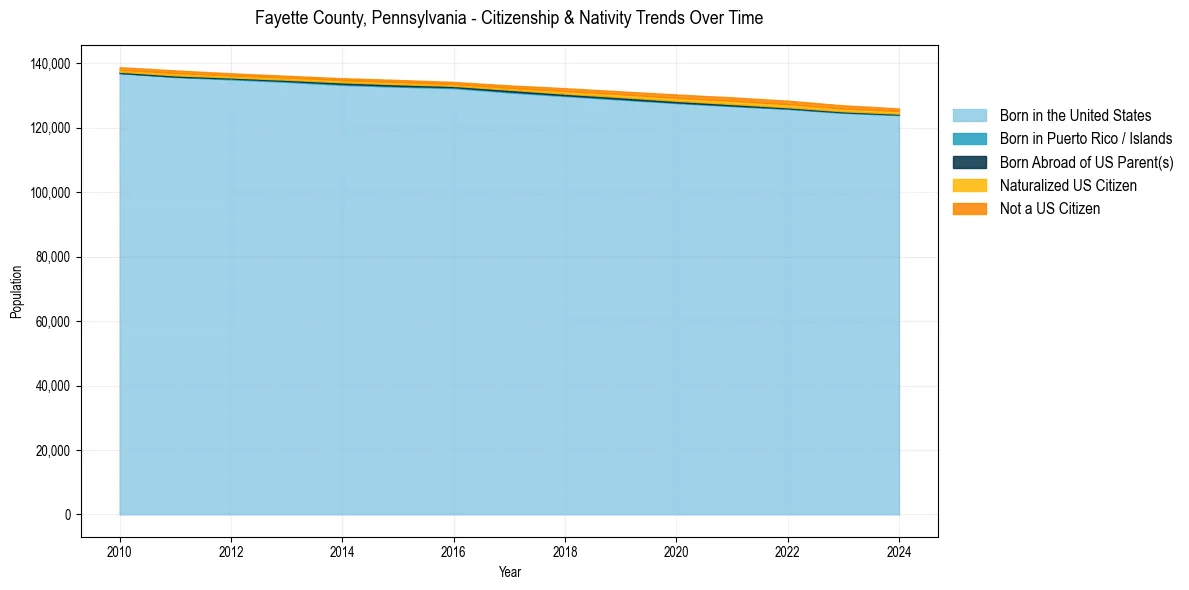
Fayette County, Pennsylvania Population & Nativity History
| Year | Total Pop | Foreign Born | Native Born |
|---|---|---|---|
| 2024 | 125,997 | 1.3% | 98.7% |
| 2023 | 126,967 | 1.5% | 98.5% |
| 2022 | 128,417 | 1.6% | 98.4% |
| 2021 | 129,443 | 1.6% | 98.4% |
| 2020 | 130,329 | 1.5% | 98.5% |
| 2019 | 131,302 | 1.4% | 98.6% |
| 2018 | 132,289 | 1.3% | 98.7% |
| 2017 | 133,160 | 1.0% | 99.0% |
| 2016 | 134,229 | 0.9% | 99.1% |
| 2015 | 134,851 | 1.0% | 99.0% |
| 2014 | 135,376 | 0.9% | 99.1% |
| 2013 | 136,145 | 0.9% | 99.1% |
| 2012 | 136,914 | 0.9% | 99.1% |
| 2011 | 137,803 | 1.1% | 98.9% |
| 2010 | 138,807 | 1.0% | 99.0% |
Nativity & Citizenship FAQs for Fayette County, Pennsylvania
Approximately 1.3% of residents in Fayette County, Pennsylvania were born outside the United States.
The vast majority of residents, roughly 99.4%, are U.S. citizens (including both native-born and naturalized citizens).