Erie County, Pennsylvania Nativity & Citizenship Status (2024)
Place of birth and citizenship status analysis for Erie County, Pennsylvania
Erie County, Pennsylvania Nativity & Citizenship Indicators (2024)
Native Born
95.1%
Foreign Born
4.9%
Naturalized
2.7%
US Citizens
97.8%
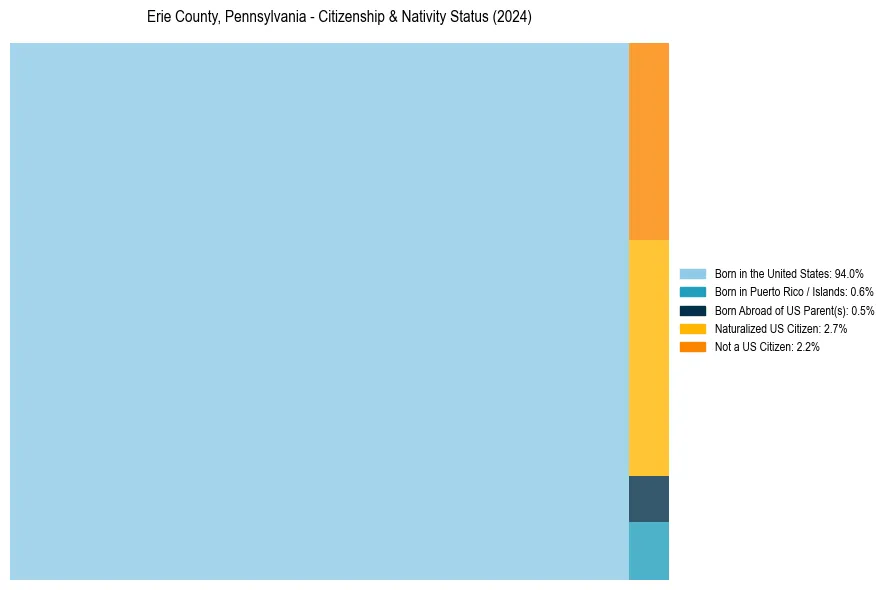
Erie County, Pennsylvania Nativity & Citizenship Distribution
Erie County, Pennsylvania Historical Nativity Trends (2010–2024)
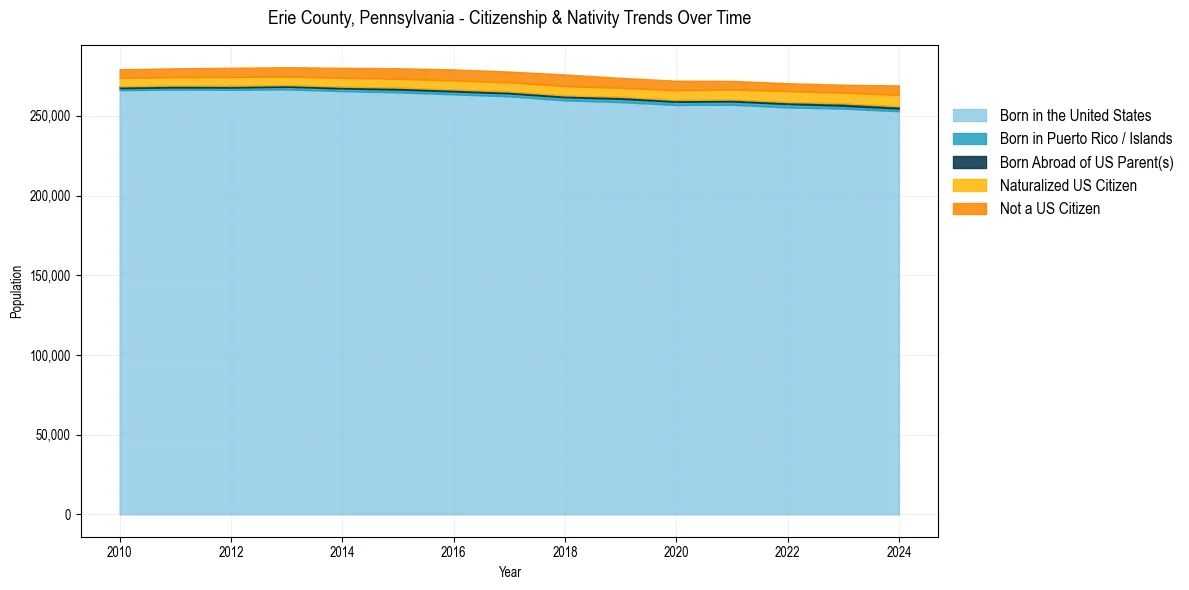
Erie County, Pennsylvania Population & Nativity History
| Year | Total Pop | Foreign Born | Native Born |
|---|---|---|---|
| 2024 | 269,052 | 4.9% | 95.1% |
| 2023 | 269,544 | 4.4% | 95.6% |
| 2022 | 270,495 | 4.4% | 95.6% |
| 2021 | 271,903 | 4.3% | 95.7% |
| 2020 | 272,046 | 4.4% | 95.6% |
| 2019 | 273,835 | 4.4% | 95.6% |
| 2018 | 275,972 | 4.8% | 95.2% |
| 2017 | 277,794 | 4.5% | 95.5% |
| 2016 | 279,133 | 4.5% | 95.5% |
| 2015 | 279,858 | 4.3% | 95.7% |
| 2014 | 280,132 | 4.2% | 95.8% |
| 2013 | 280,518 | 4.0% | 96.0% |
| 2012 | 280,181 | 4.0% | 96.0% |
| 2011 | 279,824 | 3.9% | 96.1% |
| 2010 | 279,234 | 3.8% | 96.2% |
Nativity & Citizenship FAQs for Erie County, Pennsylvania
Approximately 4.9% of residents in Erie County, Pennsylvania were born outside the United States.
The vast majority of residents, roughly 97.8%, are U.S. citizens (including both native-born and naturalized citizens).