Delaware County, Pennsylvania Nativity & Citizenship Status (2024)
Place of birth and citizenship status analysis for Delaware County, Pennsylvania
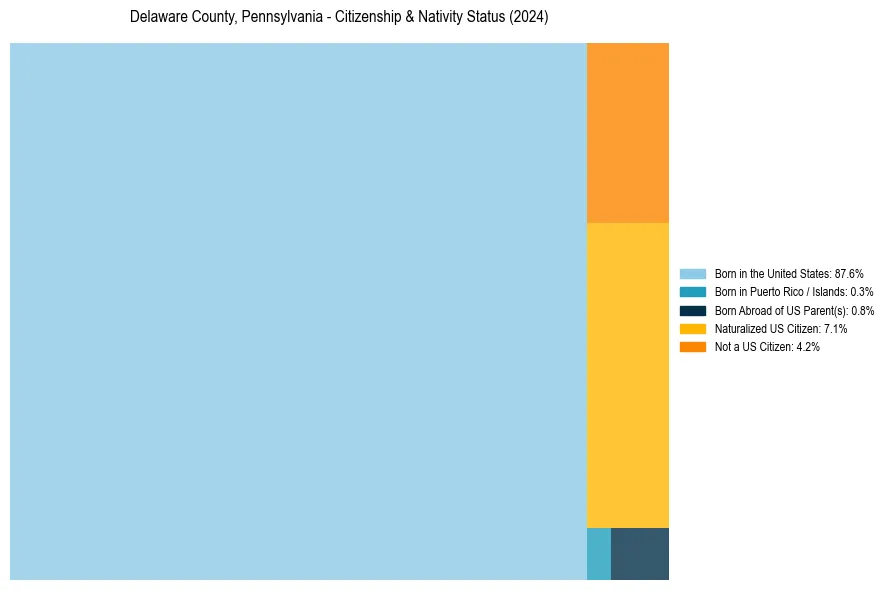
Delaware County, Pennsylvania Nativity & Citizenship Indicators (2024)
Native Born
88.8%
Foreign Born
11.2%
Naturalized
7.1%
US Citizens
95.8%
Delaware County, Pennsylvania Nativity & Citizenship Distribution
Delaware County, Pennsylvania Historical Nativity Trends (2010–2024)
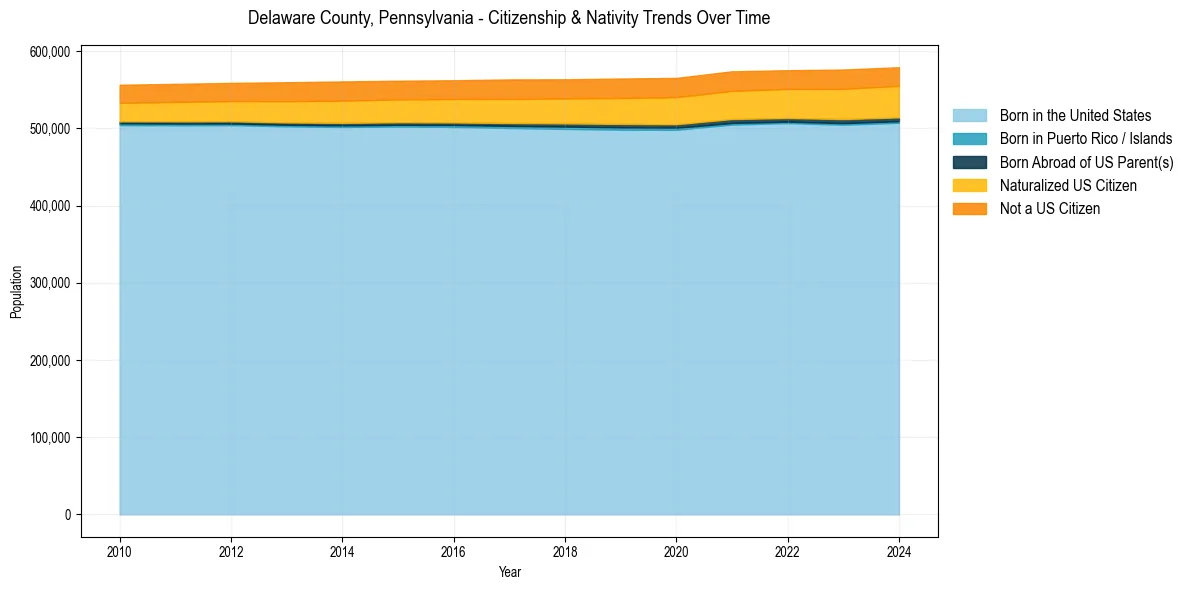
Delaware County, Pennsylvania Population & Nativity History
| Year | Total Pop | Foreign Born | Native Born |
|---|---|---|---|
| 2024 | 579,222 | 11.2% | 88.8% |
| 2023 | 576,195 | 11.1% | 88.9% |
| 2022 | 575,312 | 10.8% | 89.2% |
| 2021 | 573,883 | 10.8% | 89.2% |
| 2020 | 565,328 | 10.6% | 89.4% |
| 2019 | 564,554 | 10.4% | 89.6% |
| 2018 | 563,527 | 10.1% | 89.9% |
| 2017 | 563,384 | 10.0% | 90.0% |
| 2016 | 562,316 | 9.7% | 90.3% |
| 2015 | 561,683 | 9.6% | 90.4% |
| 2014 | 560,775 | 9.6% | 90.4% |
| 2013 | 559,771 | 9.3% | 90.7% |
| 2012 | 558,874 | 8.9% | 91.1% |
| 2011 | 557,648 | 8.7% | 91.3% |
| 2010 | 556,468 | 8.5% | 91.5% |
Nativity & Citizenship FAQs for Delaware County, Pennsylvania
Approximately 11.2% of residents in Delaware County, Pennsylvania were born outside the United States.
The vast majority of residents, roughly 95.8%, are U.S. citizens (including both native-born and naturalized citizens).