Dauphin County, Pennsylvania Nativity & Citizenship Status (2024)
Place of birth and citizenship status analysis for Dauphin County, Pennsylvania
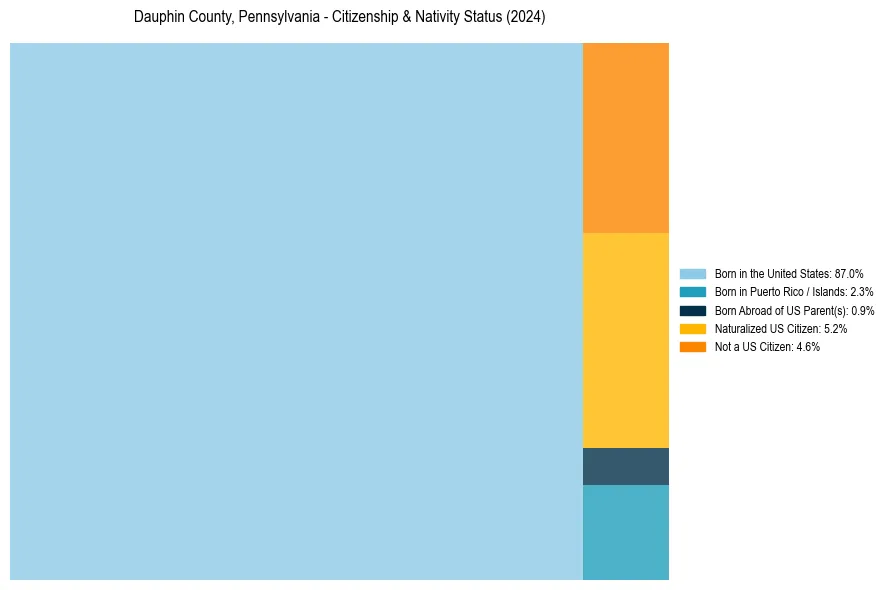
Dauphin County, Pennsylvania Nativity & Citizenship Indicators (2024)
Native Born
90.2%
Foreign Born
9.8%
Naturalized
5.2%
US Citizens
95.4%
Dauphin County, Pennsylvania Nativity & Citizenship Distribution
Dauphin County, Pennsylvania Historical Nativity Trends (2010–2024)
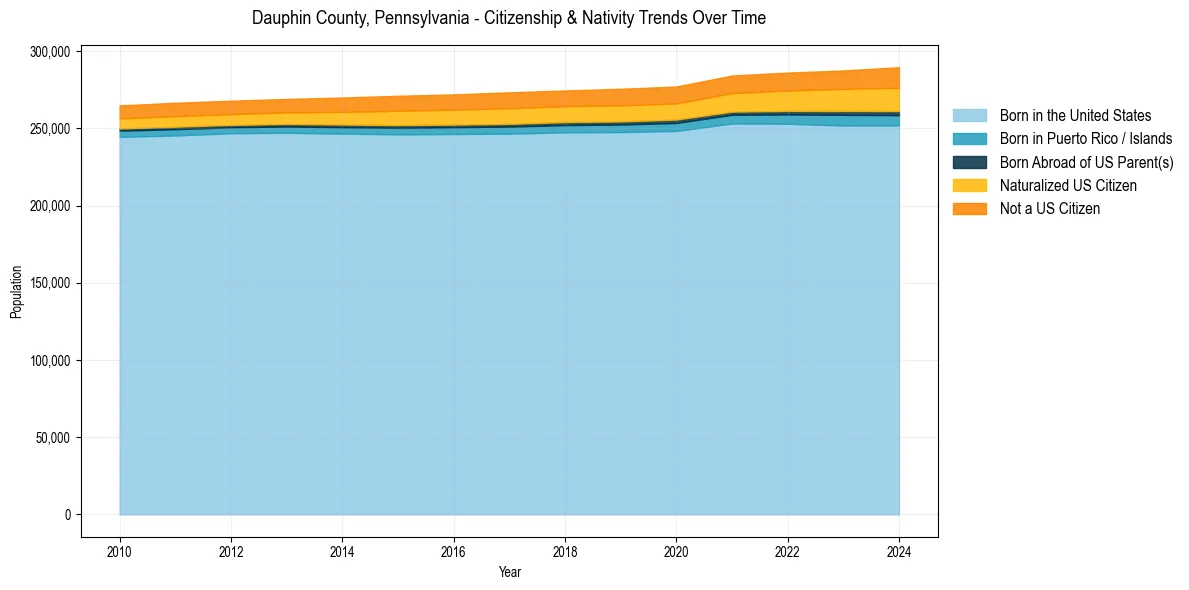
Dauphin County, Pennsylvania Population & Nativity History
| Year | Total Pop | Foreign Born | Native Born |
|---|---|---|---|
| 2024 | 289,593 | 9.8% | 90.2% |
| 2023 | 287,484 | 9.1% | 90.9% |
| 2022 | 286,108 | 8.7% | 91.3% |
| 2021 | 284,199 | 8.2% | 91.8% |
| 2020 | 277,071 | 7.7% | 92.3% |
| 2019 | 275,632 | 7.7% | 92.3% |
| 2018 | 274,515 | 7.5% | 92.5% |
| 2017 | 273,329 | 7.5% | 92.5% |
| 2016 | 271,962 | 7.2% | 92.8% |
| 2015 | 271,094 | 7.0% | 93.0% |
| 2014 | 269,946 | 6.5% | 93.5% |
| 2013 | 269,035 | 6.0% | 94.0% |
| 2012 | 267,891 | 5.9% | 94.1% |
| 2011 | 266,576 | 5.8% | 94.2% |
| 2010 | 264,823 | 5.6% | 94.4% |
Nativity & Citizenship FAQs for Dauphin County, Pennsylvania
Approximately 9.8% of residents in Dauphin County, Pennsylvania were born outside the United States.
The vast majority of residents, roughly 95.4%, are U.S. citizens (including both native-born and naturalized citizens).