Cumberland County, Pennsylvania Nativity & Citizenship Status (2024)
Place of birth and citizenship status analysis for Cumberland County, Pennsylvania
Cumberland County, Pennsylvania Nativity & Citizenship Indicators (2024)
Native Born
92.5%
Foreign Born
7.5%
Naturalized
4.1%
US Citizens
96.5%
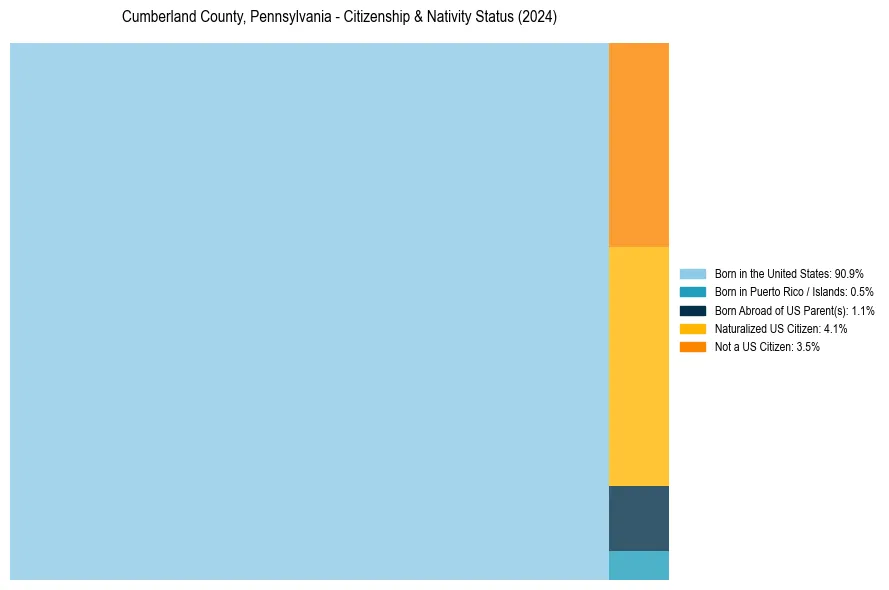
Cumberland County, Pennsylvania Nativity & Citizenship Distribution
Cumberland County, Pennsylvania Historical Nativity Trends (2010–2024)
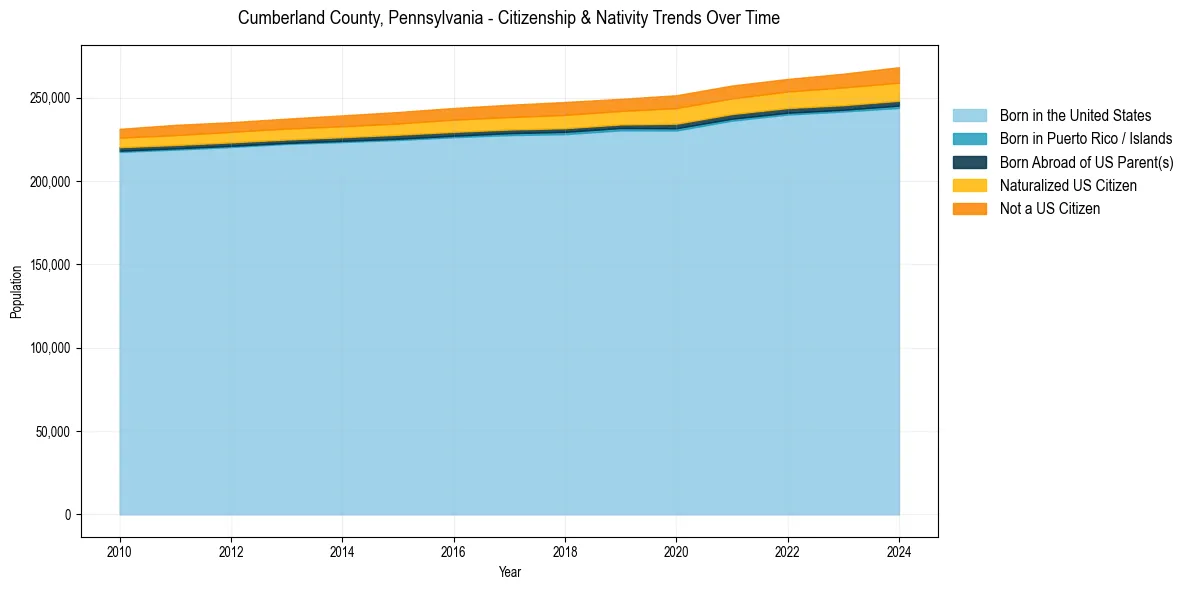
Cumberland County, Pennsylvania Population & Nativity History
| Year | Total Pop | Foreign Born | Native Born |
|---|---|---|---|
| 2024 | 268,323 | 7.5% | 92.5% |
| 2023 | 264,422 | 7.1% | 92.9% |
| 2022 | 261,269 | 6.7% | 93.3% |
| 2021 | 257,333 | 6.7% | 93.3% |
| 2020 | 251,487 | 6.8% | 93.2% |
| 2019 | 249,328 | 6.2% | 93.8% |
| 2018 | 247,433 | 6.4% | 93.6% |
| 2017 | 245,801 | 6.1% | 93.9% |
| 2016 | 243,838 | 5.9% | 94.1% |
| 2015 | 241,427 | 5.7% | 94.3% |
| 2014 | 239,420 | 5.5% | 94.5% |
| 2013 | 237,449 | 5.3% | 94.7% |
| 2012 | 235,314 | 5.1% | 94.9% |
| 2011 | 233,726 | 5.2% | 94.8% |
| 2010 | 231,336 | 4.8% | 95.2% |
Nativity & Citizenship FAQs for Cumberland County, Pennsylvania
Approximately 7.5% of residents in Cumberland County, Pennsylvania were born outside the United States.
The vast majority of residents, roughly 96.5%, are U.S. citizens (including both native-born and naturalized citizens).