Crawford County, Pennsylvania Nativity & Citizenship Status (2024)
Place of birth and citizenship status analysis for Crawford County, Pennsylvania
Crawford County, Pennsylvania Nativity & Citizenship Indicators (2024)
Native Born
98.8%
Foreign Born
1.2%
Naturalized
0.8%
US Citizens
99.6%
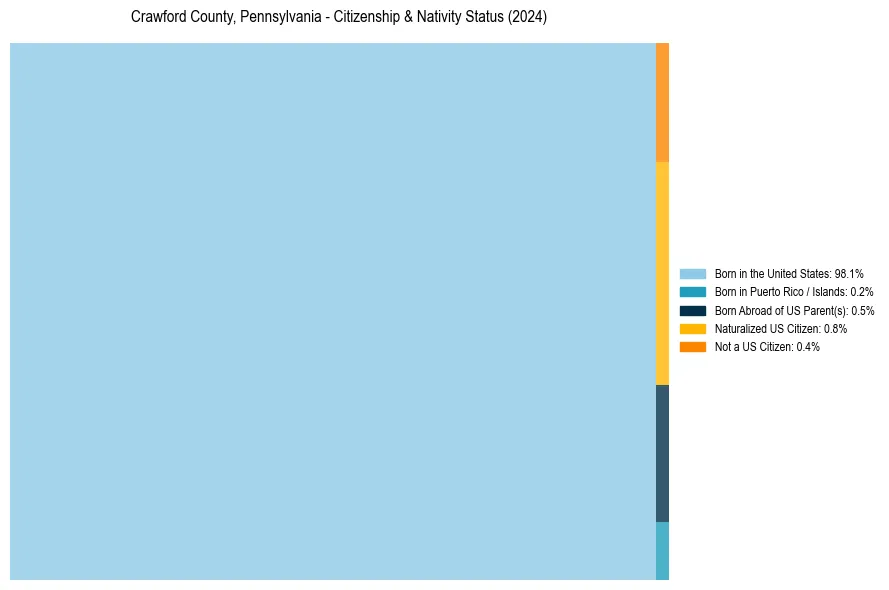
Crawford County, Pennsylvania Nativity & Citizenship Distribution
Crawford County, Pennsylvania Historical Nativity Trends (2010–2024)
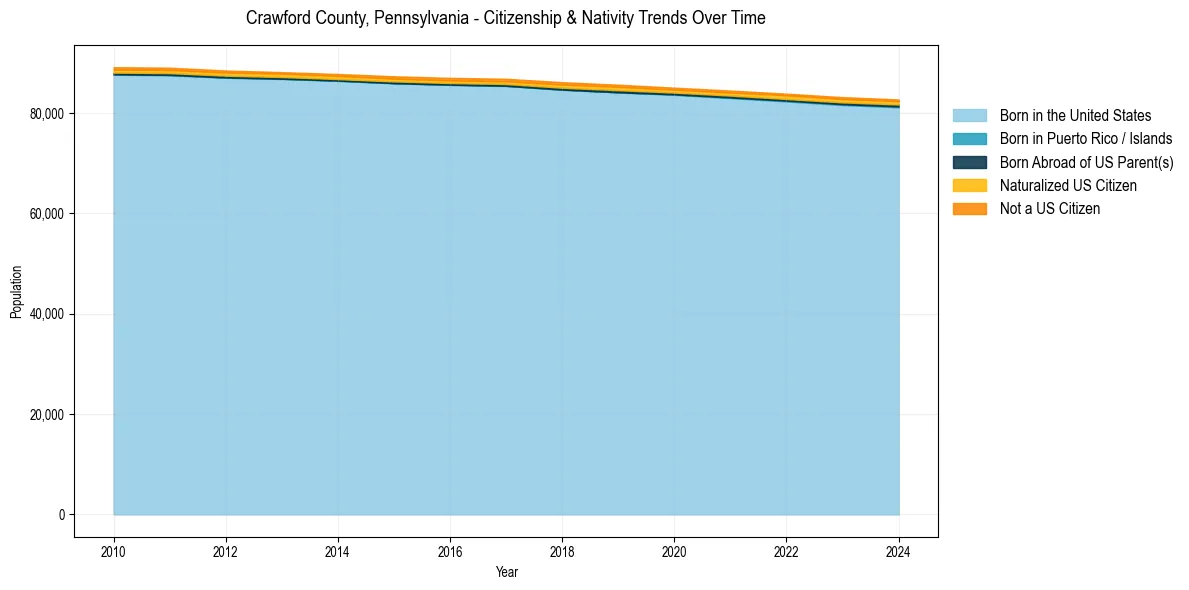
Crawford County, Pennsylvania Population & Nativity History
| Year | Total Pop | Foreign Born | Native Born |
|---|---|---|---|
| 2024 | 82,716 | 1.2% | 98.8% |
| 2023 | 83,189 | 1.3% | 98.7% |
| 2022 | 83,876 | 1.3% | 98.7% |
| 2021 | 84,495 | 1.2% | 98.8% |
| 2020 | 85,074 | 1.2% | 98.8% |
| 2019 | 85,665 | 1.3% | 98.7% |
| 2018 | 86,164 | 1.3% | 98.7% |
| 2017 | 86,847 | 1.2% | 98.8% |
| 2016 | 87,027 | 1.2% | 98.8% |
| 2015 | 87,343 | 1.2% | 98.8% |
| 2014 | 87,801 | 1.2% | 98.8% |
| 2013 | 88,173 | 1.1% | 98.9% |
| 2012 | 88,492 | 1.2% | 98.8% |
| 2011 | 89,058 | 1.2% | 98.8% |
| 2010 | 89,153 | 1.2% | 98.8% |
Nativity & Citizenship FAQs for Crawford County, Pennsylvania
Approximately 1.2% of residents in Crawford County, Pennsylvania were born outside the United States.
The vast majority of residents, roughly 99.6%, are U.S. citizens (including both native-born and naturalized citizens).