Clarion County, Pennsylvania Nativity & Citizenship Status (2024)
Place of birth and citizenship status analysis for Clarion County, Pennsylvania
Clarion County, Pennsylvania Nativity & Citizenship Indicators (2024)
Native Born
99.0%
Foreign Born
1.0%
Naturalized
0.5%
US Citizens
99.5%
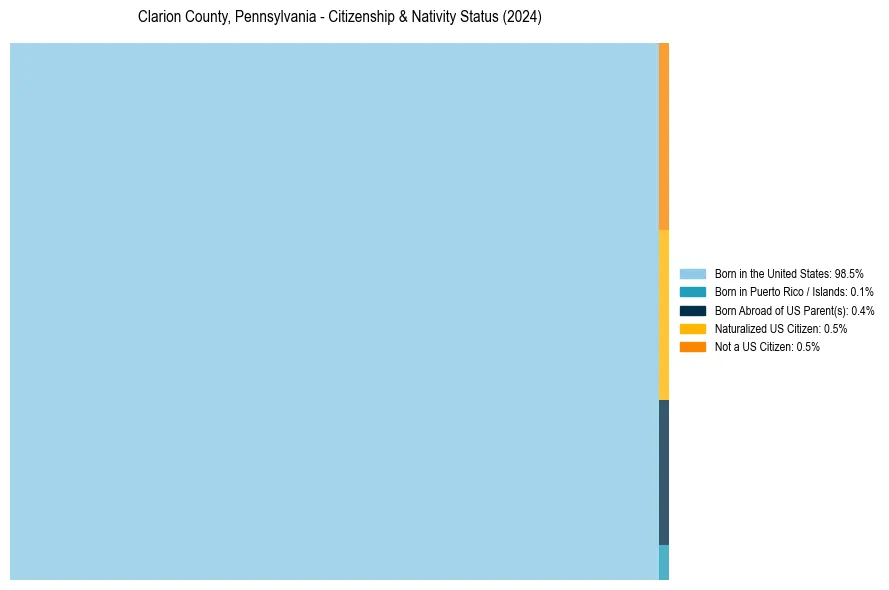
Clarion County, Pennsylvania Nativity & Citizenship Distribution
Clarion County, Pennsylvania Historical Nativity Trends (2010–2024)
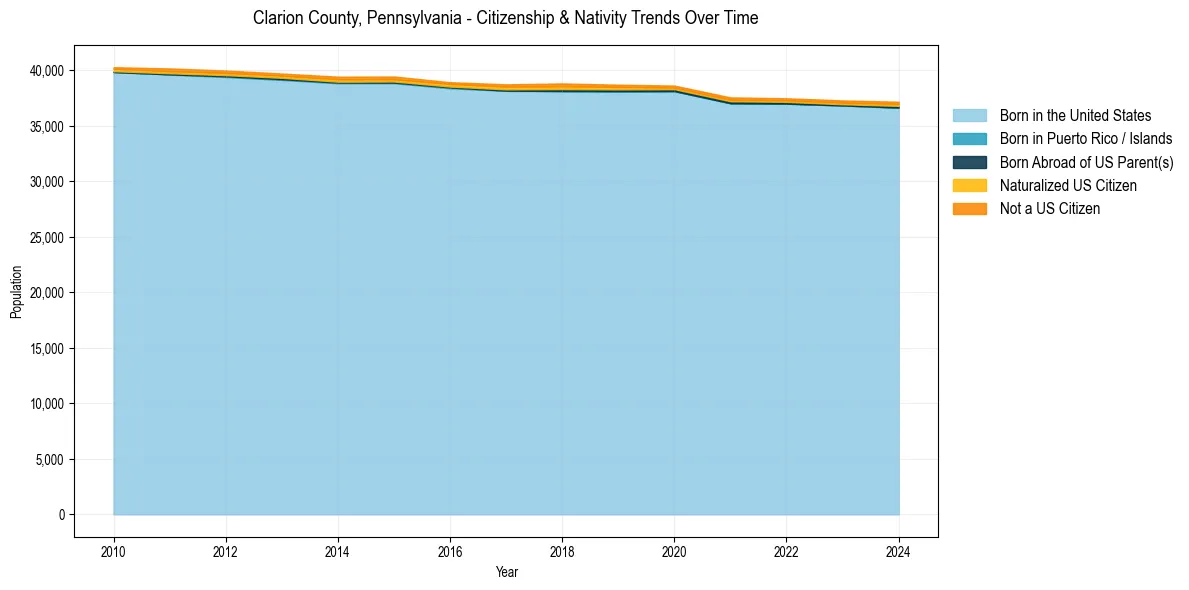
Clarion County, Pennsylvania Population & Nativity History
| Year | Total Pop | Foreign Born | Native Born |
|---|---|---|---|
| 2024 | 37,179 | 1.0% | 99.0% |
| 2023 | 37,297 | 0.9% | 99.1% |
| 2022 | 37,489 | 0.9% | 99.1% |
| 2021 | 37,571 | 0.9% | 99.1% |
| 2020 | 38,633 | 0.8% | 99.2% |
| 2019 | 38,715 | 1.1% | 98.9% |
| 2018 | 38,827 | 1.3% | 98.7% |
| 2017 | 38,747 | 1.2% | 98.8% |
| 2016 | 38,939 | 1.0% | 99.0% |
| 2015 | 39,454 | 1.2% | 98.8% |
| 2014 | 39,437 | 1.2% | 98.8% |
| 2013 | 39,720 | 1.0% | 99.0% |
| 2012 | 39,991 | 1.0% | 99.0% |
| 2011 | 40,178 | 1.1% | 98.9% |
| 2010 | 40,290 | 0.9% | 99.1% |
Nativity & Citizenship FAQs for Clarion County, Pennsylvania
Approximately 1.0% of residents in Clarion County, Pennsylvania were born outside the United States.
The vast majority of residents, roughly 99.5%, are U.S. citizens (including both native-born and naturalized citizens).