Chester County, Pennsylvania Nativity & Citizenship Status (2024)
Place of birth and citizenship status analysis for Chester County, Pennsylvania
Chester County, Pennsylvania Nativity & Citizenship Indicators (2024)
Native Born
89.9%
Foreign Born
10.1%
Naturalized
5.1%
US Citizens
95.0%
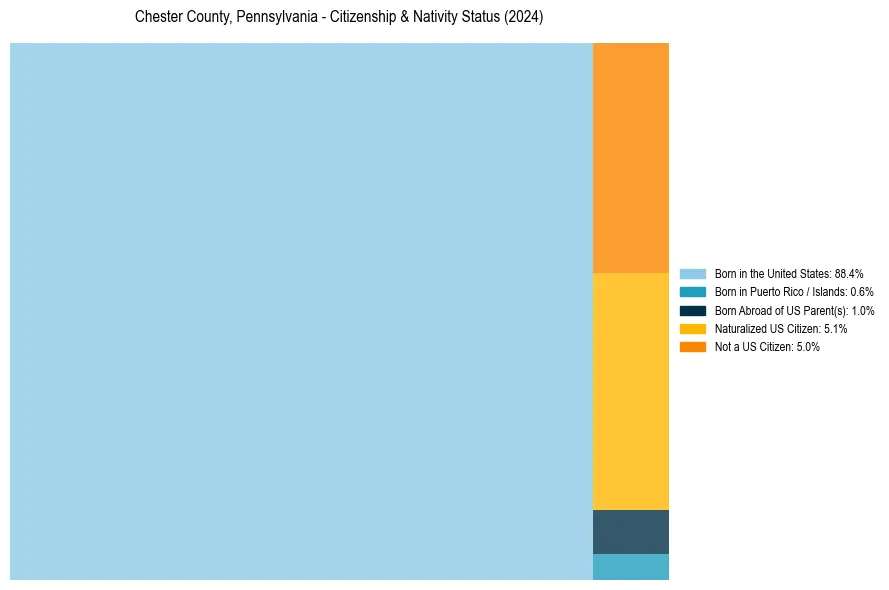
Chester County, Pennsylvania Nativity & Citizenship Distribution
Chester County, Pennsylvania Historical Nativity Trends (2010–2024)
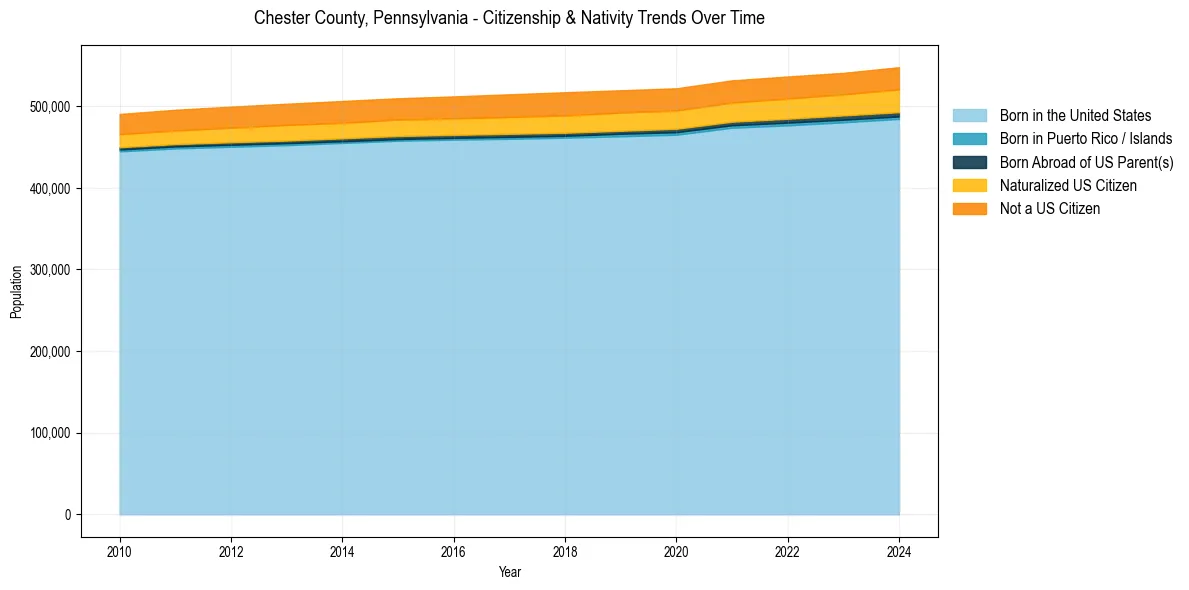
Chester County, Pennsylvania Population & Nativity History
| Year | Total Pop | Foreign Born | Native Born |
|---|---|---|---|
| 2024 | 547,840 | 10.1% | 89.9% |
| 2023 | 540,896 | 9.6% | 90.4% |
| 2022 | 536,474 | 9.7% | 90.3% |
| 2021 | 531,704 | 9.5% | 90.5% |
| 2020 | 521,980 | 9.5% | 90.5% |
| 2019 | 519,560 | 9.6% | 90.4% |
| 2018 | 517,156 | 9.6% | 90.4% |
| 2017 | 514,652 | 9.4% | 90.6% |
| 2016 | 512,028 | 9.2% | 90.8% |
| 2015 | 509,797 | 9.1% | 90.9% |
| 2014 | 506,422 | 9.0% | 91.0% |
| 2013 | 503,075 | 9.0% | 91.0% |
| 2012 | 499,548 | 8.7% | 91.3% |
| 2011 | 495,651 | 8.5% | 91.5% |
| 2010 | 490,571 | 8.3% | 91.7% |
Nativity & Citizenship FAQs for Chester County, Pennsylvania
Approximately 10.1% of residents in Chester County, Pennsylvania were born outside the United States.
The vast majority of residents, roughly 95.0%, are U.S. citizens (including both native-born and naturalized citizens).