Cambria County, Pennsylvania Nativity & Citizenship Status (2024)
Place of birth and citizenship status analysis for Cambria County, Pennsylvania
Cambria County, Pennsylvania Nativity & Citizenship Indicators (2024)
Native Born
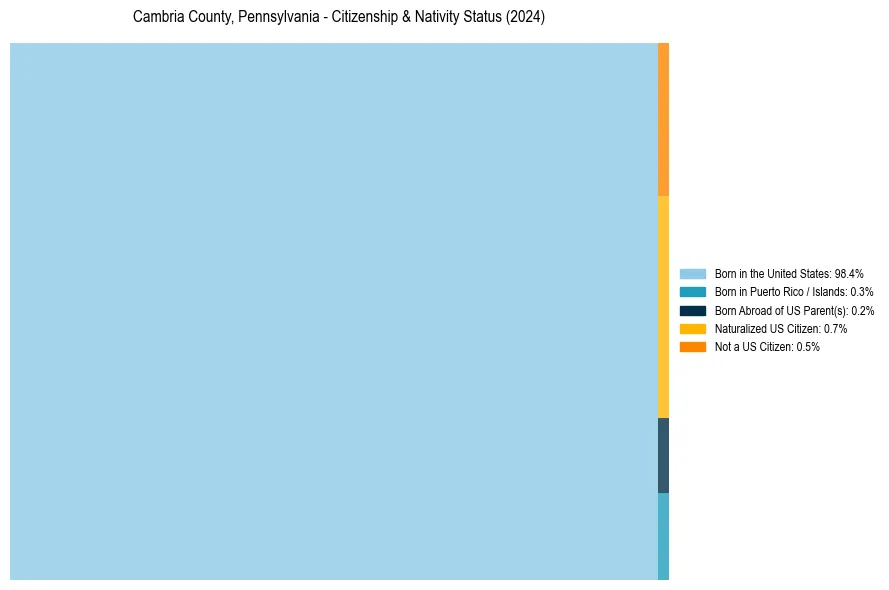
98.9%
Foreign Born
1.1%
Naturalized
0.7%
US Citizens
99.5%
Cambria County, Pennsylvania Nativity & Citizenship Distribution
Cambria County, Pennsylvania Historical Nativity Trends (2010–2024)
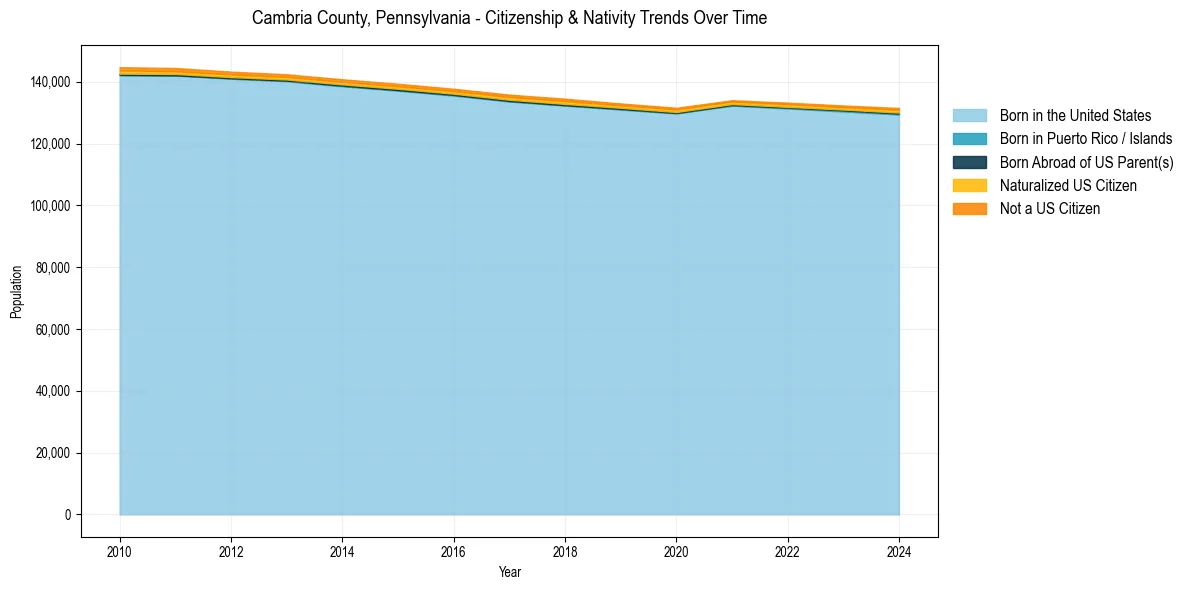
Cambria County, Pennsylvania Population & Nativity History
| Year | Total Pop | Foreign Born | Native Born |
|---|---|---|---|
| 2024 | 131,538 | 1.1% | 98.9% |
| 2023 | 132,355 | 1.0% | 99.0% |
| 2022 | 133,263 | 1.0% | 99.0% |
| 2021 | 134,048 | 0.9% | 99.1% |
| 2020 | 131,611 | 1.1% | 98.9% |
| 2019 | 133,009 | 1.1% | 98.9% |
| 2018 | 134,550 | 1.3% | 98.7% |
| 2017 | 135,871 | 1.2% | 98.8% |
| 2016 | 137,762 | 1.2% | 98.8% |
| 2015 | 139,381 | 1.2% | 98.8% |
| 2014 | 140,835 | 1.2% | 98.8% |
| 2013 | 142,448 | 1.2% | 98.8% |
| 2012 | 143,305 | 1.2% | 98.8% |
| 2011 | 144,489 | 1.4% | 98.6% |
| 2010 | 144,741 | 1.5% | 98.5% |
Nativity & Citizenship FAQs for Cambria County, Pennsylvania
Approximately 1.1% of residents in Cambria County, Pennsylvania were born outside the United States.
The vast majority of residents, roughly 99.5%, are U.S. citizens (including both native-born and naturalized citizens).