Butler County, Pennsylvania Nativity & Citizenship Status (2024)
Place of birth and citizenship status analysis for Butler County, Pennsylvania
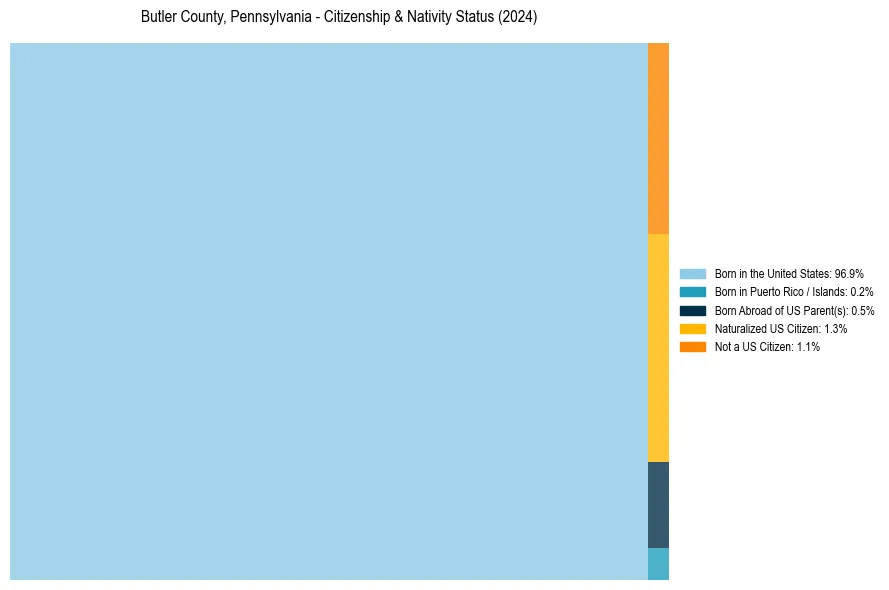
Butler County, Pennsylvania Nativity & Citizenship Indicators (2024)
Native Born
97.6%
Foreign Born
2.4%
Naturalized
1.3%
US Citizens
98.9%
Butler County, Pennsylvania Nativity & Citizenship Distribution
Butler County, Pennsylvania Historical Nativity Trends (2010–2024)
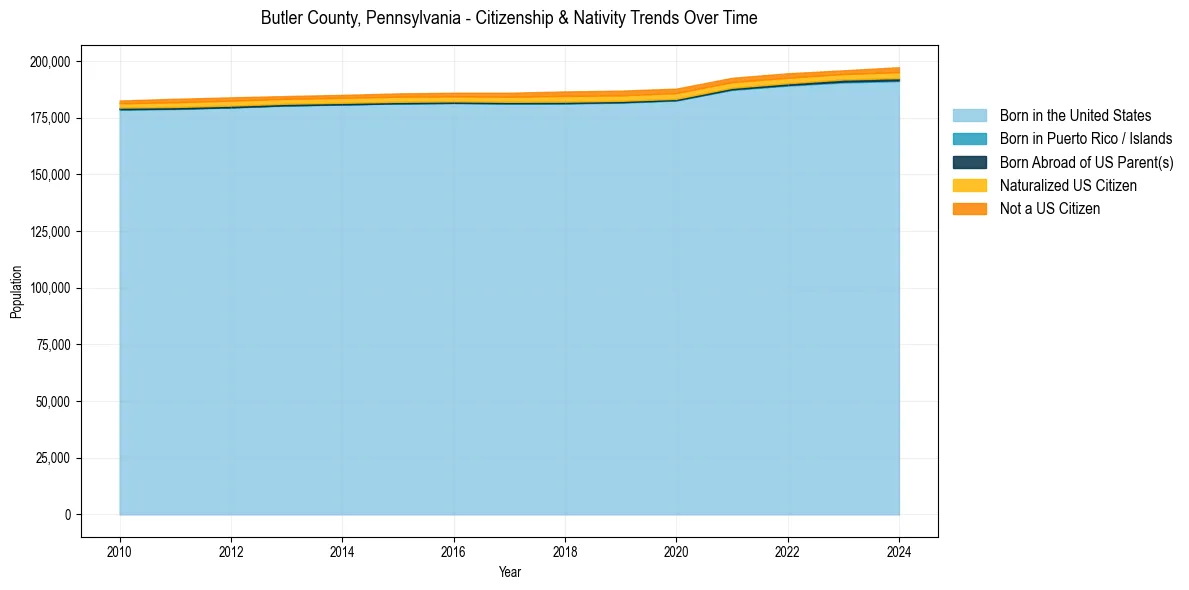
Butler County, Pennsylvania Population & Nativity History
| Year | Total Pop | Foreign Born | Native Born |
|---|---|---|---|
| 2024 | 197,254 | 2.4% | 97.6% |
| 2023 | 195,870 | 2.1% | 97.9% |
| 2022 | 194,562 | 2.3% | 97.7% |
| 2021 | 192,561 | 2.3% | 97.7% |
| 2020 | 187,798 | 2.4% | 97.6% |
| 2019 | 186,899 | 2.4% | 97.6% |
| 2018 | 186,566 | 2.4% | 97.6% |
| 2017 | 185,984 | 2.2% | 97.8% |
| 2016 | 185,974 | 2.0% | 98.0% |
| 2015 | 185,689 | 2.0% | 98.0% |
| 2014 | 185,034 | 1.9% | 98.1% |
| 2013 | 184,535 | 1.8% | 98.2% |
| 2012 | 183,946 | 2.0% | 98.0% |
| 2011 | 183,317 | 2.0% | 98.0% |
| 2010 | 182,554 | 1.7% | 98.3% |
Nativity & Citizenship FAQs for Butler County, Pennsylvania
Approximately 2.4% of residents in Butler County, Pennsylvania were born outside the United States.
The vast majority of residents, roughly 98.9%, are U.S. citizens (including both native-born and naturalized citizens).