Bucks County, Pennsylvania Nativity & Citizenship Status (2024)
Place of birth and citizenship status analysis for Bucks County, Pennsylvania
Bucks County, Pennsylvania Nativity & Citizenship Indicators (2024)
Native Born
89.6%
Foreign Born
10.4%
Naturalized
6.9%
US Citizens
96.5%
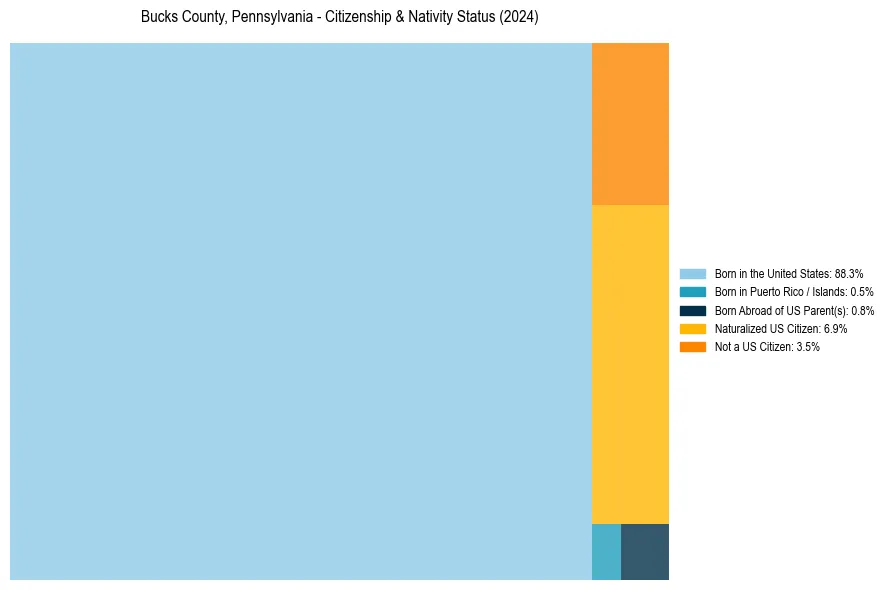
Bucks County, Pennsylvania Nativity & Citizenship Distribution
Bucks County, Pennsylvania Historical Nativity Trends (2010–2024)
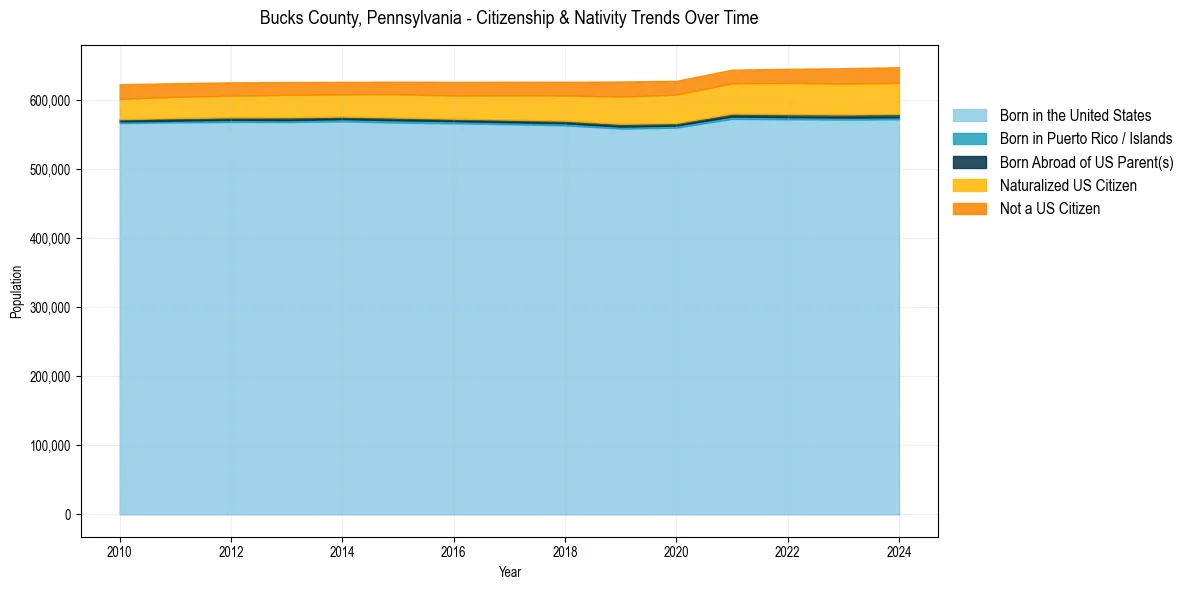
Bucks County, Pennsylvania Population & Nativity History
| Year | Total Pop | Foreign Born | Native Born |
|---|---|---|---|
| 2024 | 647,461 | 10.4% | 89.6% |
| 2023 | 645,993 | 10.4% | 89.6% |
| 2022 | 645,163 | 10.2% | 89.8% |
| 2021 | 643,872 | 9.9% | 90.1% |
| 2020 | 627,668 | 9.7% | 90.3% |
| 2019 | 626,806 | 9.8% | 90.2% |
| 2018 | 626,370 | 9.0% | 91.0% |
| 2017 | 626,486 | 8.8% | 91.2% |
| 2016 | 626,220 | 8.5% | 91.5% |
| 2015 | 626,583 | 8.3% | 91.7% |
| 2014 | 626,205 | 8.0% | 92.0% |
| 2013 | 625,977 | 8.2% | 91.8% |
| 2012 | 625,485 | 8.1% | 91.9% |
| 2011 | 624,351 | 8.1% | 91.9% |
| 2010 | 622,859 | 8.1% | 91.9% |
Nativity & Citizenship FAQs for Bucks County, Pennsylvania
Approximately 10.4% of residents in Bucks County, Pennsylvania were born outside the United States.
The vast majority of residents, roughly 96.5%, are U.S. citizens (including both native-born and naturalized citizens).