Beaver County, Pennsylvania Nativity & Citizenship Status (2024)
Place of birth and citizenship status analysis for Beaver County, Pennsylvania
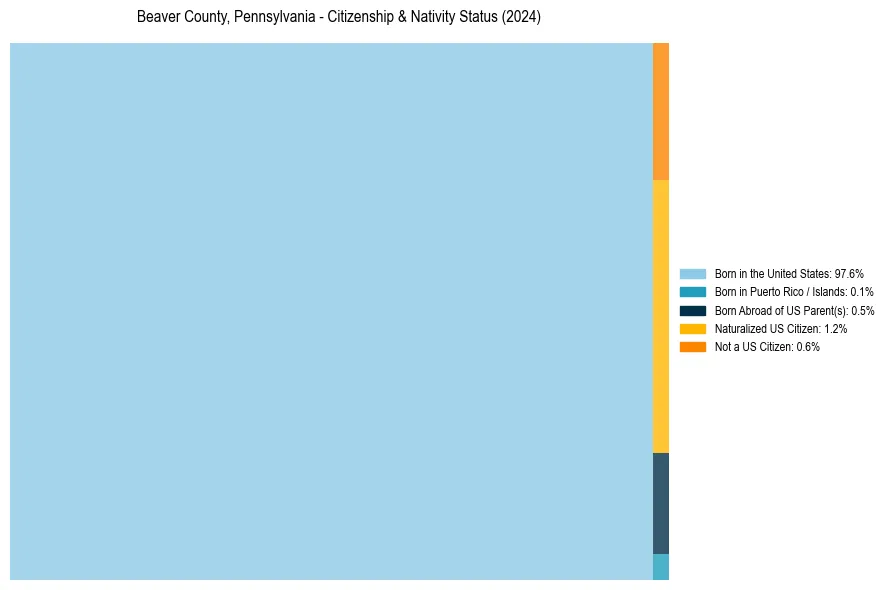
Beaver County, Pennsylvania Nativity & Citizenship Indicators (2024)
Native Born
98.1%
Foreign Born
1.9%
Naturalized
1.2%
US Citizens
99.4%
Beaver County, Pennsylvania Nativity & Citizenship Distribution
Beaver County, Pennsylvania Historical Nativity Trends (2010–2024)
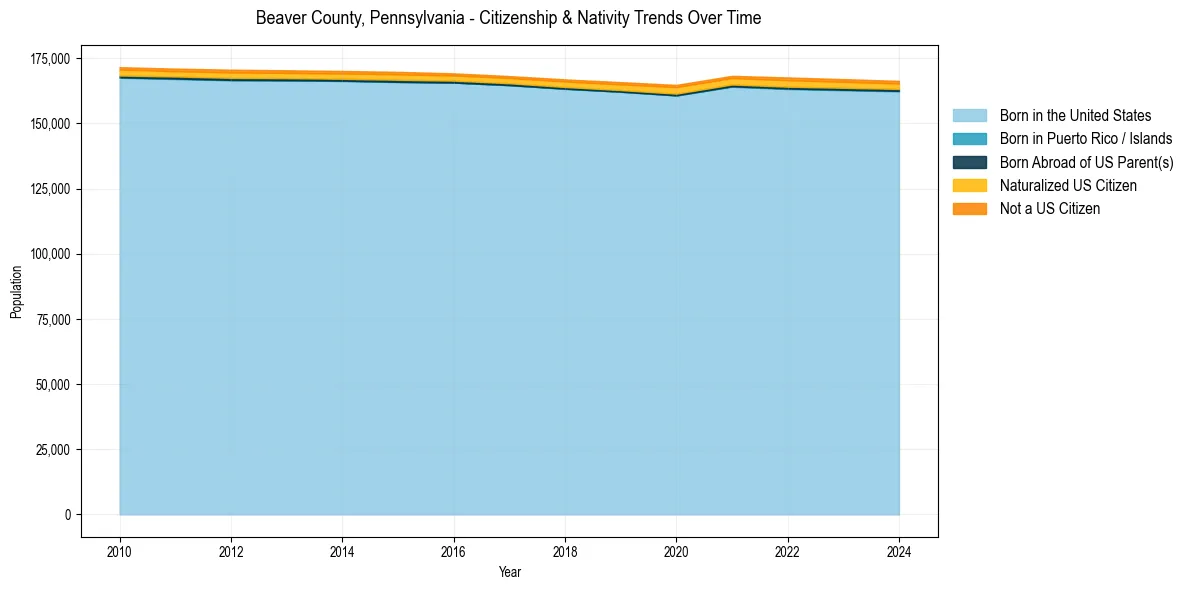
Beaver County, Pennsylvania Population & Nativity History
| Year | Total Pop | Foreign Born | Native Born |
|---|---|---|---|
| 2024 | 166,324 | 1.9% | 98.1% |
| 2023 | 166,993 | 2.0% | 98.0% |
| 2022 | 167,629 | 2.1% | 97.9% |
| 2021 | 168,260 | 2.0% | 98.0% |
| 2020 | 164,781 | 2.0% | 98.0% |
| 2019 | 165,833 | 1.8% | 98.2% |
| 2018 | 166,896 | 1.7% | 98.3% |
| 2017 | 168,161 | 1.6% | 98.4% |
| 2016 | 169,205 | 1.6% | 98.4% |
| 2015 | 169,785 | 1.8% | 98.2% |
| 2014 | 170,124 | 1.8% | 98.2% |
| 2013 | 170,382 | 1.8% | 98.2% |
| 2012 | 170,614 | 1.8% | 98.2% |
| 2011 | 171,027 | 1.8% | 98.2% |
| 2010 | 171,569 | 1.9% | 98.1% |
Nativity & Citizenship FAQs for Beaver County, Pennsylvania
Approximately 1.9% of residents in Beaver County, Pennsylvania were born outside the United States.
The vast majority of residents, roughly 99.4%, are U.S. citizens (including both native-born and naturalized citizens).