Seminole County, Oklahoma Nativity & Citizenship Status (2024)
Place of birth and citizenship status analysis for Seminole County, Oklahoma
Seminole County, Oklahoma Nativity & Citizenship Indicators (2024)
Native Born
97.6%
Foreign Born
2.4%
Naturalized
1.1%
US Citizens
98.7%
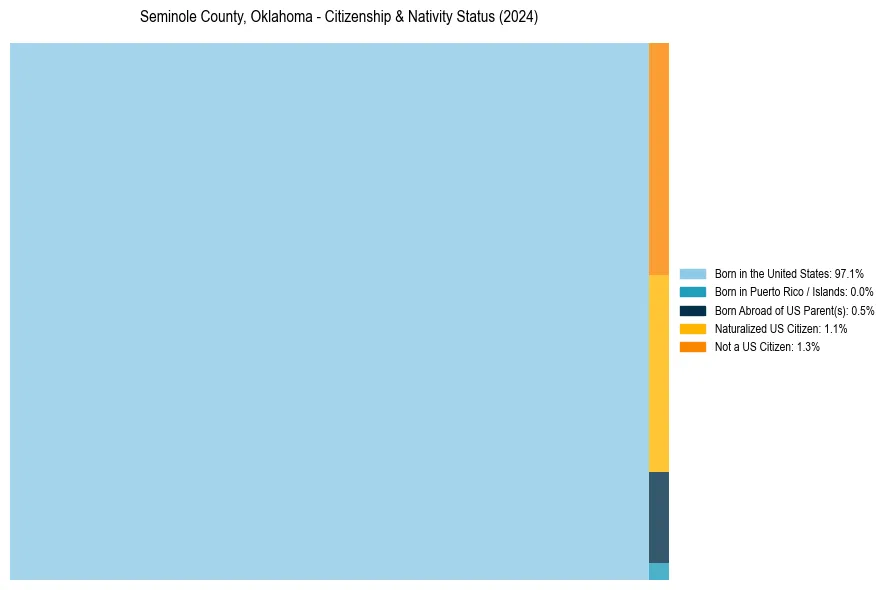
Seminole County, Oklahoma Nativity & Citizenship Distribution
Seminole County, Oklahoma Historical Nativity Trends (2010–2024)
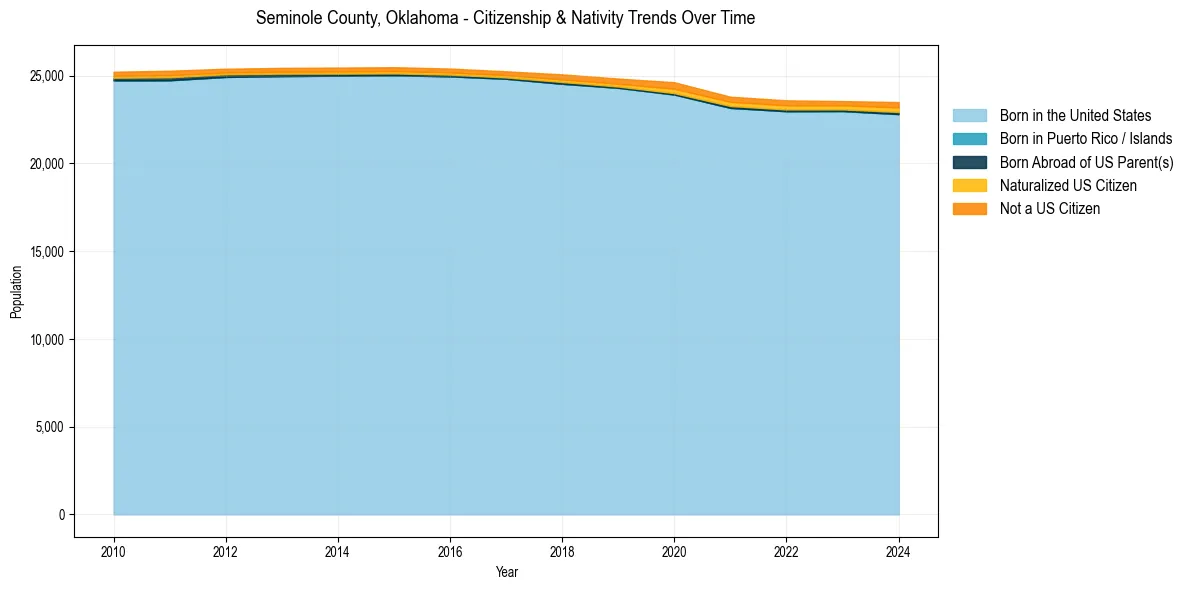
Seminole County, Oklahoma Population & Nativity History
| Year | Total Pop | Foreign Born | Native Born |
|---|---|---|---|
| 2024 | 23,494 | 2.4% | 97.6% |
| 2023 | 23,550 | 2.0% | 98.0% |
| 2022 | 23,592 | 2.2% | 97.8% |
| 2021 | 23,798 | 2.2% | 97.8% |
| 2020 | 24,624 | 2.5% | 97.5% |
| 2019 | 24,832 | 1.8% | 98.2% |
| 2018 | 25,071 | 1.7% | 98.3% |
| 2017 | 25,246 | 1.4% | 98.6% |
| 2016 | 25,403 | 1.4% | 98.6% |
| 2015 | 25,481 | 1.4% | 98.6% |
| 2014 | 25,460 | 1.4% | 98.6% |
| 2013 | 25,443 | 1.3% | 98.7% |
| 2012 | 25,394 | 1.2% | 98.8% |
| 2011 | 25,280 | 1.5% | 98.5% |
| 2010 | 25,224 | 1.4% | 98.6% |
Nativity & Citizenship FAQs for Seminole County, Oklahoma
Approximately 2.4% of residents in Seminole County, Oklahoma were born outside the United States.
The vast majority of residents, roughly 98.7%, are U.S. citizens (including both native-born and naturalized citizens).